Welcome to OSF Projects
This Article Is Licensed Under CCO For Maximum Reuse.
The following is a Table of Contents that links directly to specific sections within the guide.
- Overview
- Getting Started
- Parts of an OSF Project
- Organize and Manage your OSF Project
- Control Access
- Overview
- Manage contributors
- Sharing & Discoverability
- Advanced Uses
- FAQs
- Back to Main Support Page
Overview
What is an OSF Project?
An OSF Project is a flexible, collaborative workspace where researchers can plan, manage, and share any part of their research lifecycle. A project might represent a study, lab group, paper, dataset, or collaboration—anything that benefits from contributors, files, notes, or structured organization.
Projects can include files, wikis, tags, links, registrations, and integrations with cloud storage and other tools. They serve as a centralized hub for individual or team-based research workflows, whether for internal collaboration or public sharing.
Who Uses OSF Projects and Why?
OSF Projects are used by individuals and teams across disciplines who need a centralized, version-controlled place to:
- Plan: Start with a rough idea, define goals, and build out a structure.
- Organize: Use components, folders, and tags to keep everything tidy and modular.
- Collaborate: Add contributors with specific roles and permissions.
- Share: Make projects public or shareable via links, or keep them private for internal collaboration.
- Preserve: Convert any project into a preregistration or a long-term record.
Common Use Cases for OSF Projects:
- Individual researchers creating a reproducible record of a study.
- Lab groups organizing shared workspaces by topic, project phase, or team.
- Collaborative grants or consortia managing multi-site or interdisciplinary research.
- Course instructors guiding student projects in a shared template.
- Meta-researchers structuring reproducible workflows and data curation pipelines.
What are Components?
Components are optional sub-projects nested within a parent project. They’re used to break a large project into smaller parts—for example, organizing by experiment phase, lab member, dataset, or publication. Each component is independently configurable: it has its own contributors, files, add-ons, and privacy settings.
Projects and components follow a parent-child hierarchy, which helps teams structure work clearly, especially when collaborating across institutions or disciplines.
Learn how to create and manage components in our Create a Component section
Getting Started
Whether you’re starting from scratch or using a pre-built template, this section will walk you through the steps to get up and running with an OSF Project. OSF Projects are flexible workspaces that support everything from individual studies to multi-team collaborations.
Option 1: Create a New Project From Scratch
Creating a new project is fast and simple.

Steps:
- Go to your OSF dashboard.
- Click the “Create new project” button.
- Enter a project title
- (Optional) Add an institutional affiliation if applicable.
- Choose a storage location (United States, Canada, Germany, or Australia).
- (Optional) Enter a short project description.
- Click Create Project.
You now have a blank OSF Project to customize!
Next steps: Add components, upload files, and invite collaborators.
Option 2: Start a Project From a Template
Using a template saves time by giving you a structure you can build on. You can use one of your existing projects as a template or choose from publicly shared examples.
Use Your Own Project as a Template
- From your dashboard, click “Create new project.”
- Choose a project from the Template dropdown menu.
- Click Create.
Your new project will inherit the structure (components and titles) of the original but none of the content.

Use a Public Project as a Template
- Visit the public OSF project you'd like to use.
- In the top right, click the Duplicate icon.
- Select “Duplicate project (structure only).”
-
Confirm by clicking Create.
Your version will be a personal copy of the structure with no added files or connected add-ons. The title will begin with “Templated from…”

Example Templates
Explore templates to see what layout works best for your needs:
|
Creator(s) |
Template Name/ Discipline |
Link |
Description |
| Eric Olson | Lab Manager Research Group | https://osf.io/5mk6w/ | Includes multiple research initiatives, each with its own component. Follows the research lifecycle. |
| Eric Olson | Course/Classroom Management | https://osf.io/rtsjq/ | Structure for educators to share course materials, syllabi, and assignments. |
| Eric Olson | Electronic Lab Notebook (ELN) | https://osf.io/ptdqx/ | A digital version of a traditional lab notebook for experiment tracking. |
| Eric Olson | Data Management Template | https://osf.io/guq4j/ | Organized around data lifecycle planning and compliance with DMP requirements. |
| Eric Olson | Research Team Coordination | https://osf.io/q9sy4/ | Built to manage grants, manuscripts, and collaborative tasks across teams. |
| Felipe Vilanova | Social Psychology | https://osf.io/kv9u2/ | This project is focused on the relationship between ideologies and corruption. In particular, how distinct ideologies are related to distinct components of corruption from a psychological perspective. |
| Flavio Azevedo, Sam Parsons (FORRT) | Open scholarship, Open science, Meta-science | https://osf.io/g29eu/ | In a nutshell, FORRT (https://forrt.org/) is a Framework for Open and Reproducible Research Training. It aims to provide a pedagogical infrastructure designed to recognize and support the teaching and mentoring of open and reproducible science tenets in tandem with prototypical subject matters in higher education. |
| Daniel Umpierre | Health Sciences | https://osf.io/8f67a/ | Repository of materials for the course "Open and Reproducible Science" (PPG-Cardiology UFRGS, 2020) |
| Gizem Solmaz-Ratzlaff | Education | https://osf.io/xu3wd/ | The K-TEEM is designed to measure mathematical knowledge for teaching at the early elementary level. |
| Bawan Amin | Ecology | https://osf.io/4ymc8/ | This project contains the manuscript (including additional versions) and supplementary files to the publication. That includes also the data and scripts used in the analysis. We will also use this page to communicate additional updates/protocols if needed. |
| Georgia Richards | Health Research | https://osf.io/h239s/ | We are a global collective of early-career researchers and clinicians working in different areas of health research and practice. We actively engage in open science practices, conduct meta-research, and shine a light on research transparency, integrity and open research practices. |
To use one:
- Open the public template link from the table above to view the project’s overview page
-
In the top right, click the Duplicate icon to make your own copy.
OSF Storage Caps
Overview: OSF has storage caps on all OSF projects private projects and components utilizing OSF Storage are limited to 5 GB and public projects and components to 50 GB, and users are encouraged to utilize storage Add-ons for increasing these limits wherever possible..
Set a Global Storage Location
Overview: When creating a project, you can set a preferred storage region (U.S. or Germany) to meet institutional or privacy requirements. Note: not all locations are available, choose the location that comply with your storage requirements. This can only be done at the creation of a project and can not be changed after.
Example: Researchers in the EU may want to use the Germany-based storage node to comply with GDPR.
Learn How to Set Storage Location » (replace with your actual URL in accounts guide)
Parts of an OSF Project
OSF projects come with a suite of tools designed to help you organize, collaborate, document, and share your research. Below, you’ll find detailed steps on how to access each tool, an overview of what the tool does, and common use cases to help you understand how it fits into your workflow.
Understanding the Parts of an OSF Project
Each OSF Project includes modular components.
|
Part |
Description |
| Components | Sub-projects or folders to organize different parts of your work. |
| Contributors | Collaborators with customizable permission levels. |
| Wiki | Editable documentation or research narrative. |
| Files | Upload and organize files directly or through storage add-ons. |
| Add-ons | Connect to outside tools like Dropbox, Google Drive, GitHub, etc. |
| Privacy Settings | Projects and components can be public or private. |
| Metadata | Add tags, subjects, and descriptions to improve discoverability. |
| License | Select an open license (e.g., CC0, MIT) for your project. |
| Recent Activity | See a timeline of changes made to the project. |
| Analytics | Monitor views and downloads. |
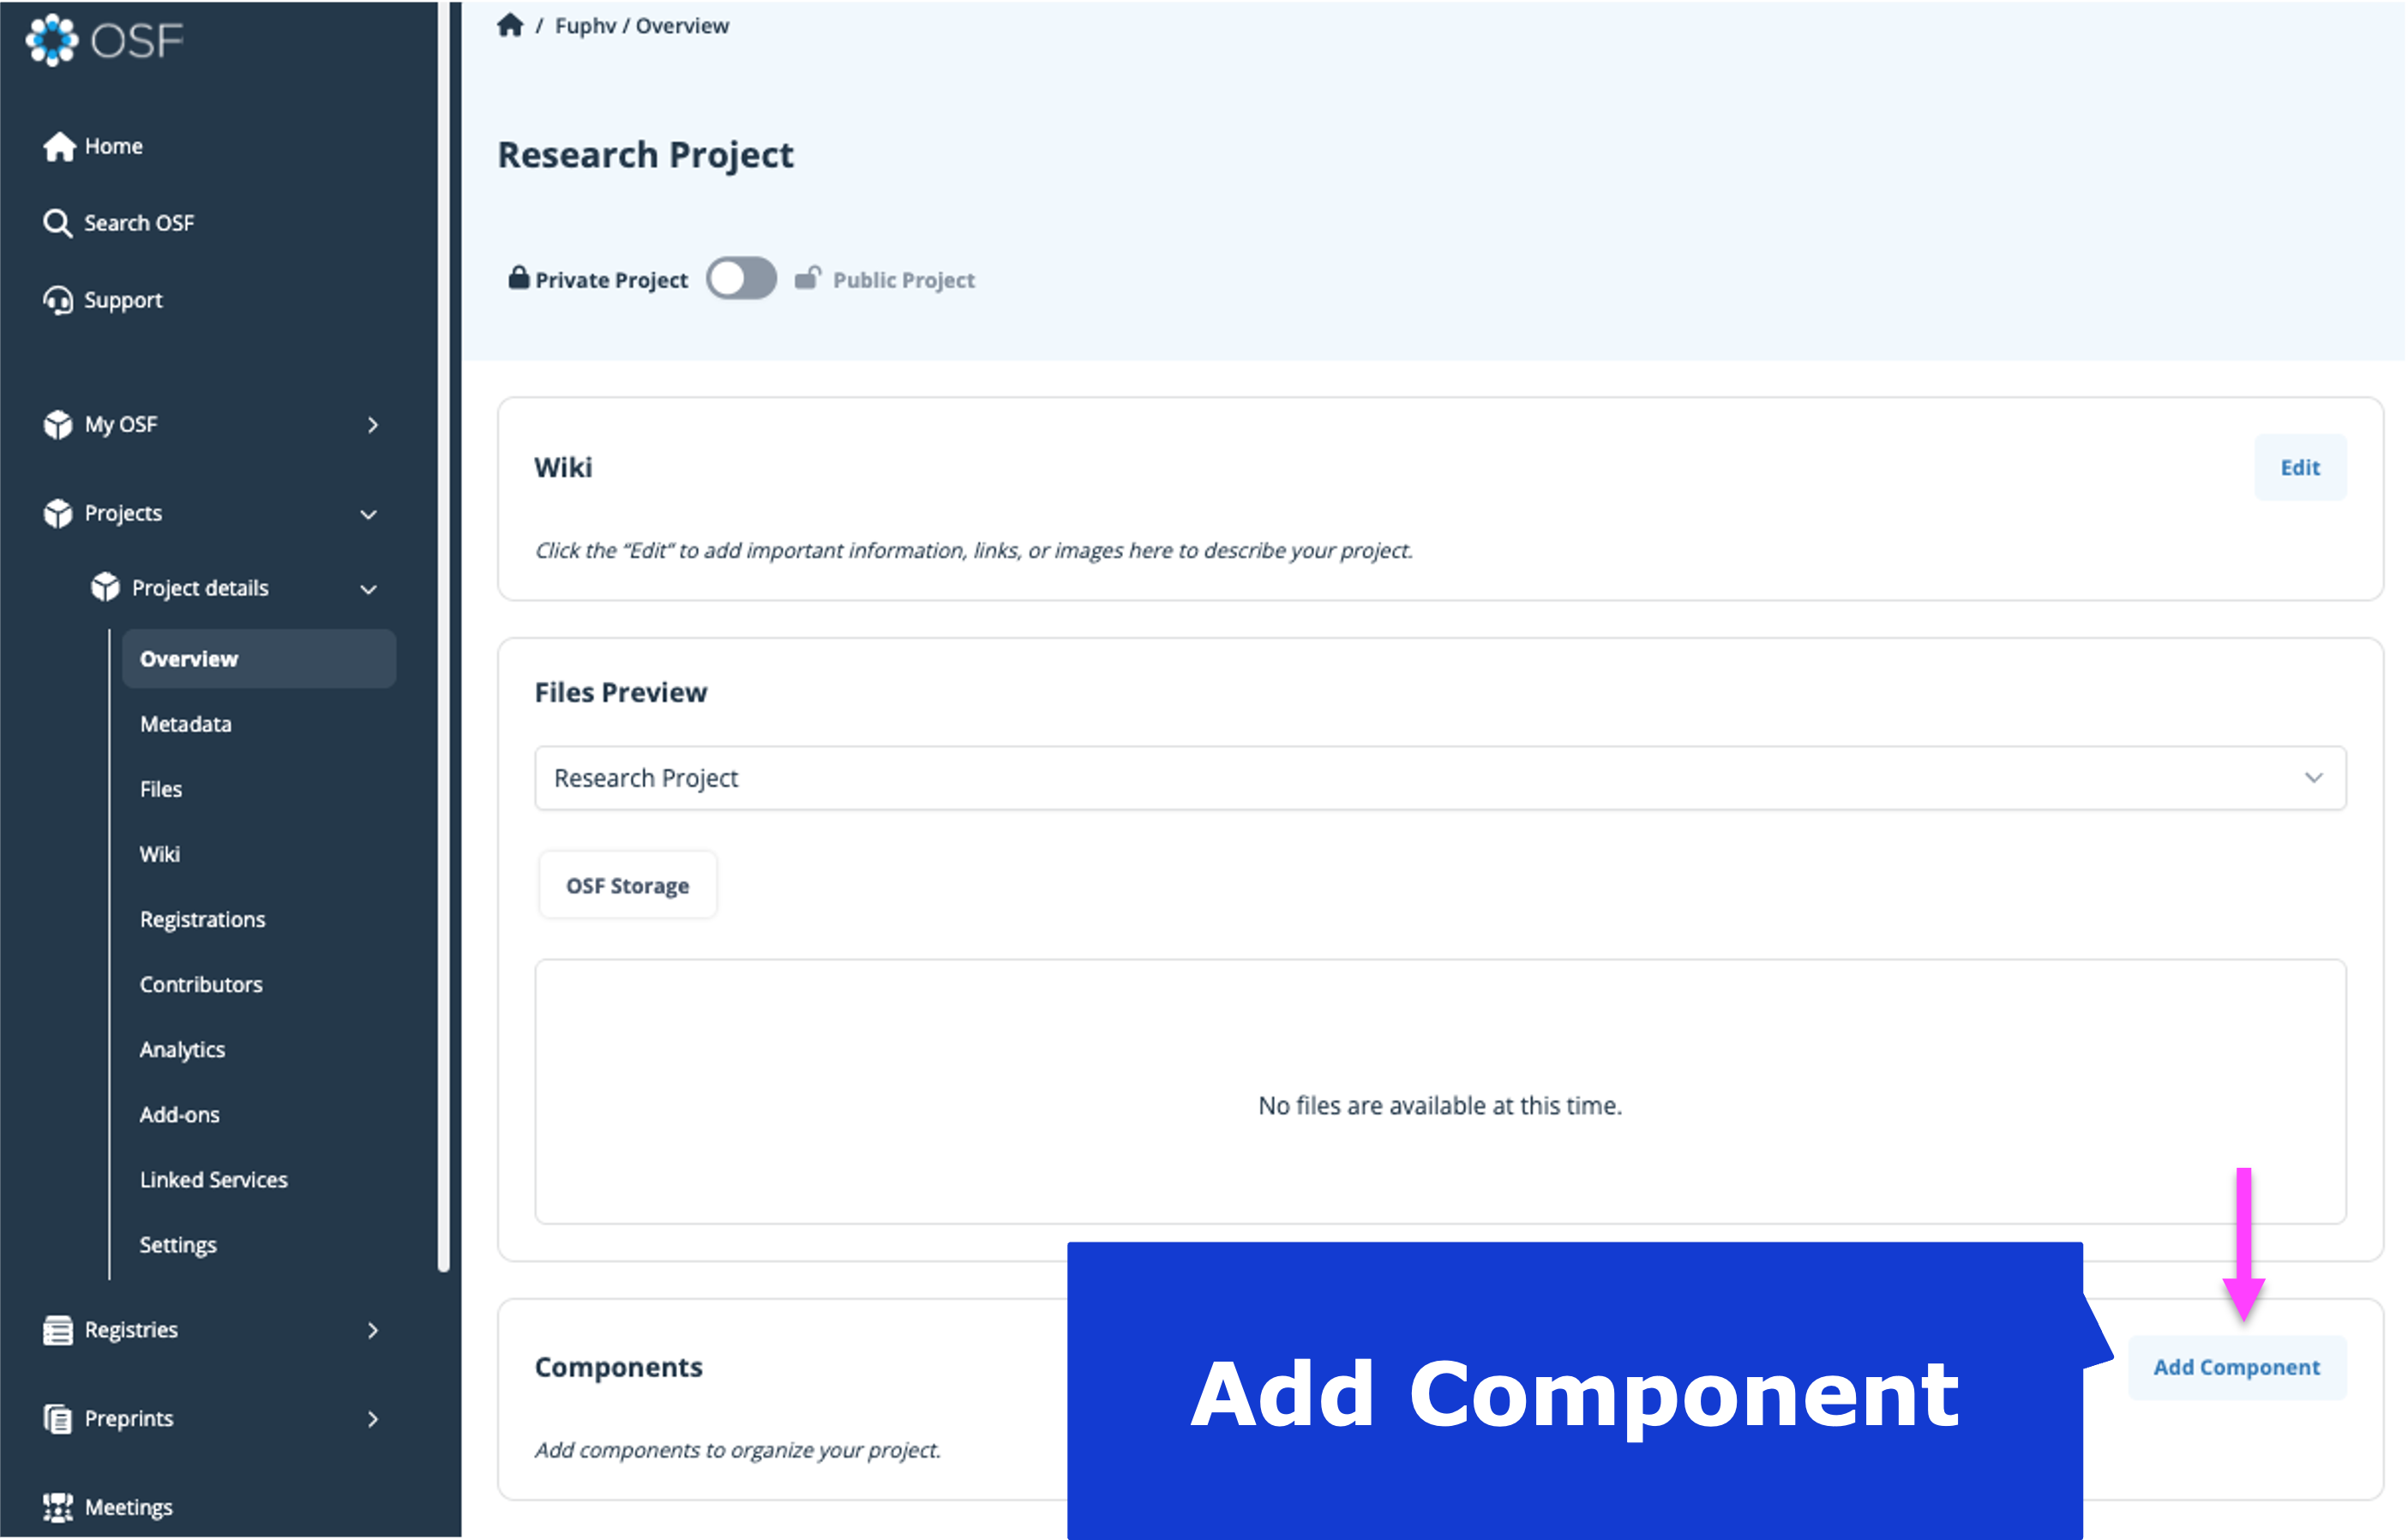
Components
How to Access:
- Open your OSF project page.
- Look at the middle of the project page and find the “Components” section.
- Click “Add Component” button or under Components in the sidebar.
- You will be prompted to name your new component and set its privacy.
What it Does:
Components are like sub-projects within your main project. They function as independent projects that can have their own contributors, files, privacy settings, and tools. This lets you break a large research project into smaller parts for easier management and collaboration.
Basic Use Cases:
- Split a large research project into multiple phases (e.g., Data Collection, Analysis, Manuscript).
- Assign different teams or collaborators to specific components without giving them access to the whole project.
- Control privacy on a granular level by making some components public and others private.
Contributors
How to Access:
- View your OSF project.
- Go to Contributors from the left navigation menu
- To add contributors, click the “Add contributor" button. Enter their email or OSF username, select their role, and set their permissions.

Advanced Contributor management
What it Does:
This tool allows you to manage who can view, edit, or administer your project. You can add team members, assign different permission levels, or remove people from the project.
Basic Use Cases:
- Add a co-author with editing rights to upload files and make changes.
- Invite a funder or reviewer with read-only access.
- Manage permissions when new collaborators join or leave.
Wiki
How to Access:
- View your OSF project.
- Go to Wiki from the left navigation menu.
- Click “Add new wiki page” to start adding content or edit existing pages. You can also click “Edit” button along the top to edit the current page wiki.
What it Does:
The Wiki is a flexible documentation space where you can write notes, instructions, meeting summaries, protocols, or any text-based content that supports your project. Changes are saved automatically with version history.
Basic Use Cases:
- Write a project overview for collaborators.
- Document lab protocols, workflows, or experimental methods.
- Keep running notes or a project timeline that all contributors can update.
Files
How to Access:
- View your OSF project.
- Go to Files from the left navigation menu.
- Use the “Upload file” button to add files from your computer or sync files via connected add-ons like Dropbox or Google Drive. You can also drag and drop files into your folder.

What it Does:
Files is your project’s file repository, where you upload and organize all research-related documents such as data sets, analysis code, manuscripts, and images. Files are version-controlled, so you can track changes and revert if needed.
Basic Use Cases:
- Upload and manage raw and processed data files.
- Store analysis scripts and code in an organized folder structure.
- Share PDFs of papers or presentations with your team.
Add-ons
How to Access:
- Open your project page.
- Click Add-ons on the left navigation menu.
- Browse available integrations such as Google Drive, Dropbox, GitHub, or Zotero.
- Click the “Connect” button under to the add-on you want to link and follow the authentication steps.
What it Does:
Add-ons connect your OSF project to external services you may already use, enabling automatic syncing and easier file sharing. This reduces duplication and keeps your project files up to date across platforms.
Basic Use Cases:
- Sync a Google Drive folder with your OSF project for automatic file updates.
- Link a GitHub repository for version-controlled code management.
- Attach a Zotero library for managing references and citations collaboratively.
Advanced Directions for Add-ons
Privacy Settings
How to Access:
- Open your project page.
- On the top of the Overview, find the “Make Public” or “Make Private” toggle button.
- Click the toggle to switch between private (restricted to contributors) or public (open to anyone).
- For components, click each component and adjust privacy individually.
What it Does:
Privacy controls who can see your project and its components. By default, projects are private until you decide to make them public. You can also control privacy settings separately for components, allowing mixed visibility.
Basic Use Cases:
- Keep your project private during early development.
- Make your data and materials publicly accessible upon publication.
- Share certain components with collaborators only, while keeping others public.
Metadata
How to Access:
- Open your project page.
- Go to Metadata on the left navigation menu
- Click “Edit” next to the metadata category you are updating.
- Add or update the project description, tags, keywords, and subject areas, Funding/ support information, Resource information, affiliated institutions, Publication DOIs, and more.
- Save your changes.

What it Does:
Metadata describes your project and makes it discoverable through OSF search and external search engines. Proper metadata improves how others find and understand your work.
Basic Use Cases:
- Add a clear and concise project summary to explain your research.
- Use relevant tags to help users searching for your topic.
- Choose subject areas that match your discipline to increase visibility.
License
How to Access:
- Open your project page.
- Go to Metadata on the left navigation menu
- Click “Edit” next to the license section. Choose from the dropdown menu of licenses
- See License your OSF Project.
What it Does:
Licenses specify the terms under which others can use, share, or cite your project materials. Applying a license clarifies reuse rights and helps promote open science.
Basic Use Cases:
- Apply a Creative Commons Attribution (CC-BY) license to your data sets.
- Use an MIT license for your code files to allow open source reuse.
- Upload a custom license to meet funder or institutional requirements.
Recent Activity
How to Access:
- Open your project page.
- Scroll down the Overview page to the “Recent Activity” feed.

What it Does:
This feed logs recent project events, such as file uploads, edits, contributor changes, and wiki updates. It helps you monitor collaboration progress and see what’s new at a glance.
Basic Use Cases:
- Track when a team member uploads new data or analysis scripts.
- See who made the latest wiki edits or added contributors.
- Keep a timeline of project updates for transparency.
Analytics
How to Access:
- Open your project page.
- Go to Analytics on the left navigation menu
- Here, you’ll see statistics about views, downloads, and traffic sources.

What it Does:
Analytics show how often your project was viewed if it was replicated or if others have created links to your project. It helps you understand the reach and engagement of your shared research outputs.
Basic Use Cases:
- Measure impact of your project after making it public.
- Identify which files or components attract the most interest.
- Track engagement trends over time.
Organize and Manage Your Project
Once you’ve created anOSF project, you’ll want to keep it organized and up to date. This section covers how to manage your projects and components—from renaming and deleting to checking storage and configuring notifications.
Rename a Project
Overview: You can change the name of any project or component at any time. Only users with Admin or Read + Write permissions can rename.
Steps:
- Open the project or component.
- Navigate to project or component Metadata
- Select “Edit”.
- Type your new name into the Title field.
- Select the blue “Save” button to save.


Example: You may want to update the name after refining your research question or transitioning from a working draft to a final version.
Delete a Project or Component
Overview: This action deletes the project and its contents permanently. All components must be deleted first. Only admins can delete.
Steps:
- Navigate to the project.
- Go to Settings from the left navigation menu.
- Click the red Delete Project button.
- Type the confirmation word.
- Click Delete.
Example: Remove an outdated or duplicate project or component.


Delete a Project with Components
Overview: If your project includes components, they must all be deleted first.
Steps:
- Go to the project’s Settings page.
- Click Delete Project.
- A list of components will appear.
- Select all components and click Continue.
- Type the confirmation word.
- Click Delete.

Example: Close out a full project when the research has concluded and you no longer need access.
Navigate Back to Parent Project
Overview: Projects can contain multiple components. You can navigate back to the parent project by selecting "Parent Project".
Steps:
- From the Component.
- Scroll to the Parent Project section.
- Click on the Parent Project.

Check Your Project or Component's Storage Usage
Overview: OSF displays storage usage so you can monitor your file uploads and stay under the caps.
Steps:
- Open your project or component.
- Look at the top of the project, next to the link button on the Overview page to see current usage.

Example: Use this feature to avoid exceeding limits during data collection.
Project Storage
Overview: Storage limits depend on privacy status. OSF Storage supports direct file uploads, but external integrations are recommended for large datasets.
- Private Projects: 5 GB total in OSF Storage
- Public Projects: 50 GB total in OSF Storage
- Max File Size: 5 GB per individual file
- Files stored and connected via an Add-on do not count against these storage limits.
- Each Component on a project has it’s own 5GB/50GB storage limit.
Example: Make your project public or add an external storage integration if you’re nearing capacity.
Configure Notifications
Overview: Stay updated with email alerts for project activity.
Steps:
- Go to your project.
- Go to Settings from the left navigation menu
- Scroll to Email Notifications.
- Choose your preferred frequency (Immediate, Daily, or None).

Example: Set daily notifications for a collaborative project to keep up with team contributions.
View Recent Activity
Overview: The Recent Activity panel logs all changes and who made them.
Steps:
- Open the project.
- Scroll down the Overview page to find Recent Activity.
Example: Check if someone uploaded the final version of a dataset or updated the wiki.
View Project Analytics
Overview: Analytics offer insights into project traffic and public interest.
Steps:
- Go to the public project.
- Go to Analytics from the left navigation menu.
- Review metrics such as views, unique visitors, and downloads.
Example: Use analytics to demonstrate outreach and engagement in a grant report.
Control Access
In this section, you'll find everything you need to manage permissions, privacy, and access on your OSF project and its components. Each tool is explained with clear step-by-step instructions, use cases, and helpful tips.
Overview
Access control on OSF is managed via:
- Contributors: Grant user permissions at project and component levels
- Import Administrators or Contributors: Quickly propagate access from parent to child
- Privacy Settings: Toggle public/private visibility
- View-only Links: Share read-only access to private content
- Access Requests: Allow users to request edit access
Manage Contributors
Add Contributors to Projects and Components
Steps to Add Contributors:
- Open your project or component.
- Click Contributors in the left menu.

- Search for a registered user or click add as an unregistered contributor to invite someone without an OSF account.
- Assign permission level (Read, Read + Write, Admin).
- Set bibliographic status (will they show in citations?).

- If adding to a component, click Next, select the components, then click Add.
Adding a Registered Contributor
If a contributor already has an account, they can be added as a registered user. Select “Add Contributor by Search”

- Then search for the contributor by name.
- Select the contributor.
- Select the appropriate permissions.
- Select "Next".

Adding an Unregistered Contributor
If a co-author already has an account, they can be added as a registered user. Select “Add Contributor by Search”
- Select “Add Unregistered Contributor”
- Enter the contributor a) name and b) email address.
- Select “Add”

You can remove contributors using the RED trash can, edit permissions by clicking the {V} arrow button, and change bibliographic status.

Use Cases:
- Add a co-author with “Read + Write” access for manuscript collaboration.
- Invite a stakeholder with “Read” access only.
- Credit a research assistant as non‑bibliographic.
Reorder Contributors
Steps to Reorder Contributors:
- Navigate to Contributors from your project
- Click the three lined icon next to the contributor name to drag and reorder
- Your changes are saved automatically
Use Cases:
- Alphabetize authors
- List the Principal Investigator first

Edit Contributor Permissions
Steps to Edit Permissions:
- Navigate to Contributors from your project
- Locate the contributor’s name.
- Use the dropdown menus next to their name to adjust permission level or bibliographic status.
Note: This can only be done as an admin on the project
Remove Contributors from Projects or Components
Steps to Remove a Contributor:
- From Contributors, click the delete icon next to the contributor’s name.
- In the confirmation dialog box, choose whether to also remove them from components.
- Click Remove.
Note: This can only be done as an admin on the project
Use Cases:
- Remove team members after project completion.
- Clean up outdated or test accounts.
Import Contributors from Parent Project into Component
Steps to Import Contributors:
- Open the component.
- Go to Contributors.
- Click Add Contributor, then select Import contributors.
- Choose whom to import; adjust permissions if desired.
- Click Add.
Use Cases:
- Establish consistent permissions across project hierarchies.
- Save time onboarding in structured workflows.
Add Admins from Parent Project to a Component
Steps to Add Admins:
- In the component, go to Contributors.
- Locate the Admins on Parent Projects section.
- Click the green Add next to each admin you want to add.
Use Cases:
- Ensure a PI or lab lead has admin rights on all nested components.
- Maintain oversight across distributed workspaces.
Understand Contributor Permissions
Permission Levels:
|
Level |
Project Actions |
| Admin | Full control : add/remove contributors, change privacy, delete project/components, manage view-only links, view all components (including ones created by other contributors) |
| Read + Write | Upload/delete files, edit wiki, manage add-ons/components, view analytics. |
| Read | View project content only. Access limited to browsing. |
Permissions apply separately to projects, components, registrations, or preprints.
Use Cases:
- Grant elevated rights for administrators.
- Limit collaborator access to read-only for data sharing.
Allow Access Requests
Contributor Side:
- As an admin on an OSF Project, you have the ability to allow/deny Access Requests.
- For Private projects or components, this would allow users to request access to view your project or component.
- For Public projects or components, this would allow users to request to join your project or component as a contributor.
- To turn on/off Access Requests.
- Navigate to your Settings.
- To allow access check the "allow users to request access to your project" box.

Grant Access via Access Requests
As a project admin, you’ll receive email alerts and see pending requests under Contributors.
Steps to Grant Access:
- Navigate to Contributors.
- Under Requests for access, locate the user.
- Click Checkmark to approve or X to deny access.

Request Access to a Private or Public Project
User Side:
- From a private project URL, click Request Access.
- An admin will receive a notification and can accept or refuse your request.
- If approved, you gain contributor access. No cancellation option if pending.
- If you click “Request Access” twice, you will receive an error
Public Projects:
- Viewing requires no approval.
- To gain edit rights, use Request Access and wait for admin approval.
Sharing & Discoverability of OSF Projects
The Open Science Framework (OSF) offers several ways to share your research and increase its discoverability. Whether your project is public or private, you can use a variety of tools to connect your work with peers, get cited, and track reuse.
Below is a quick reference table outlining all available actions to share and make your OSF project more discoverable.
|
Action |
Purpose |
Visibility |
Requires Admin? |
| View-only Link | Share a private project with selected viewers via a unique URL | Private projects | Yes |
| Generate Citations | Provide formatted citations for your work in common styles | Public & Private | No |
|
Share |
Distribute your project on social media | Public projects | No |
| Duplicate / Template | Allow reuse through copying of project (with files), or copying (structure only) as a Template | Public projects | No |
| Create a DOI | Generate a persistent identifier to cite your work in scholarly publishing | Public only | Yes |
| Add to a Collection | Group your project with related work for higher visibility | Public only | Yes |
Create a View-only Link
Purpose: Share a private project with collaborators, reviewers, or the public without making the entire project public.
NOTE: Any registrations associated with the project will NOT be included in this view only link, you need to create a separate view-only link for registrations. See instructions for Create a View-only link for a Registration.
Steps to Create a View-only Link:
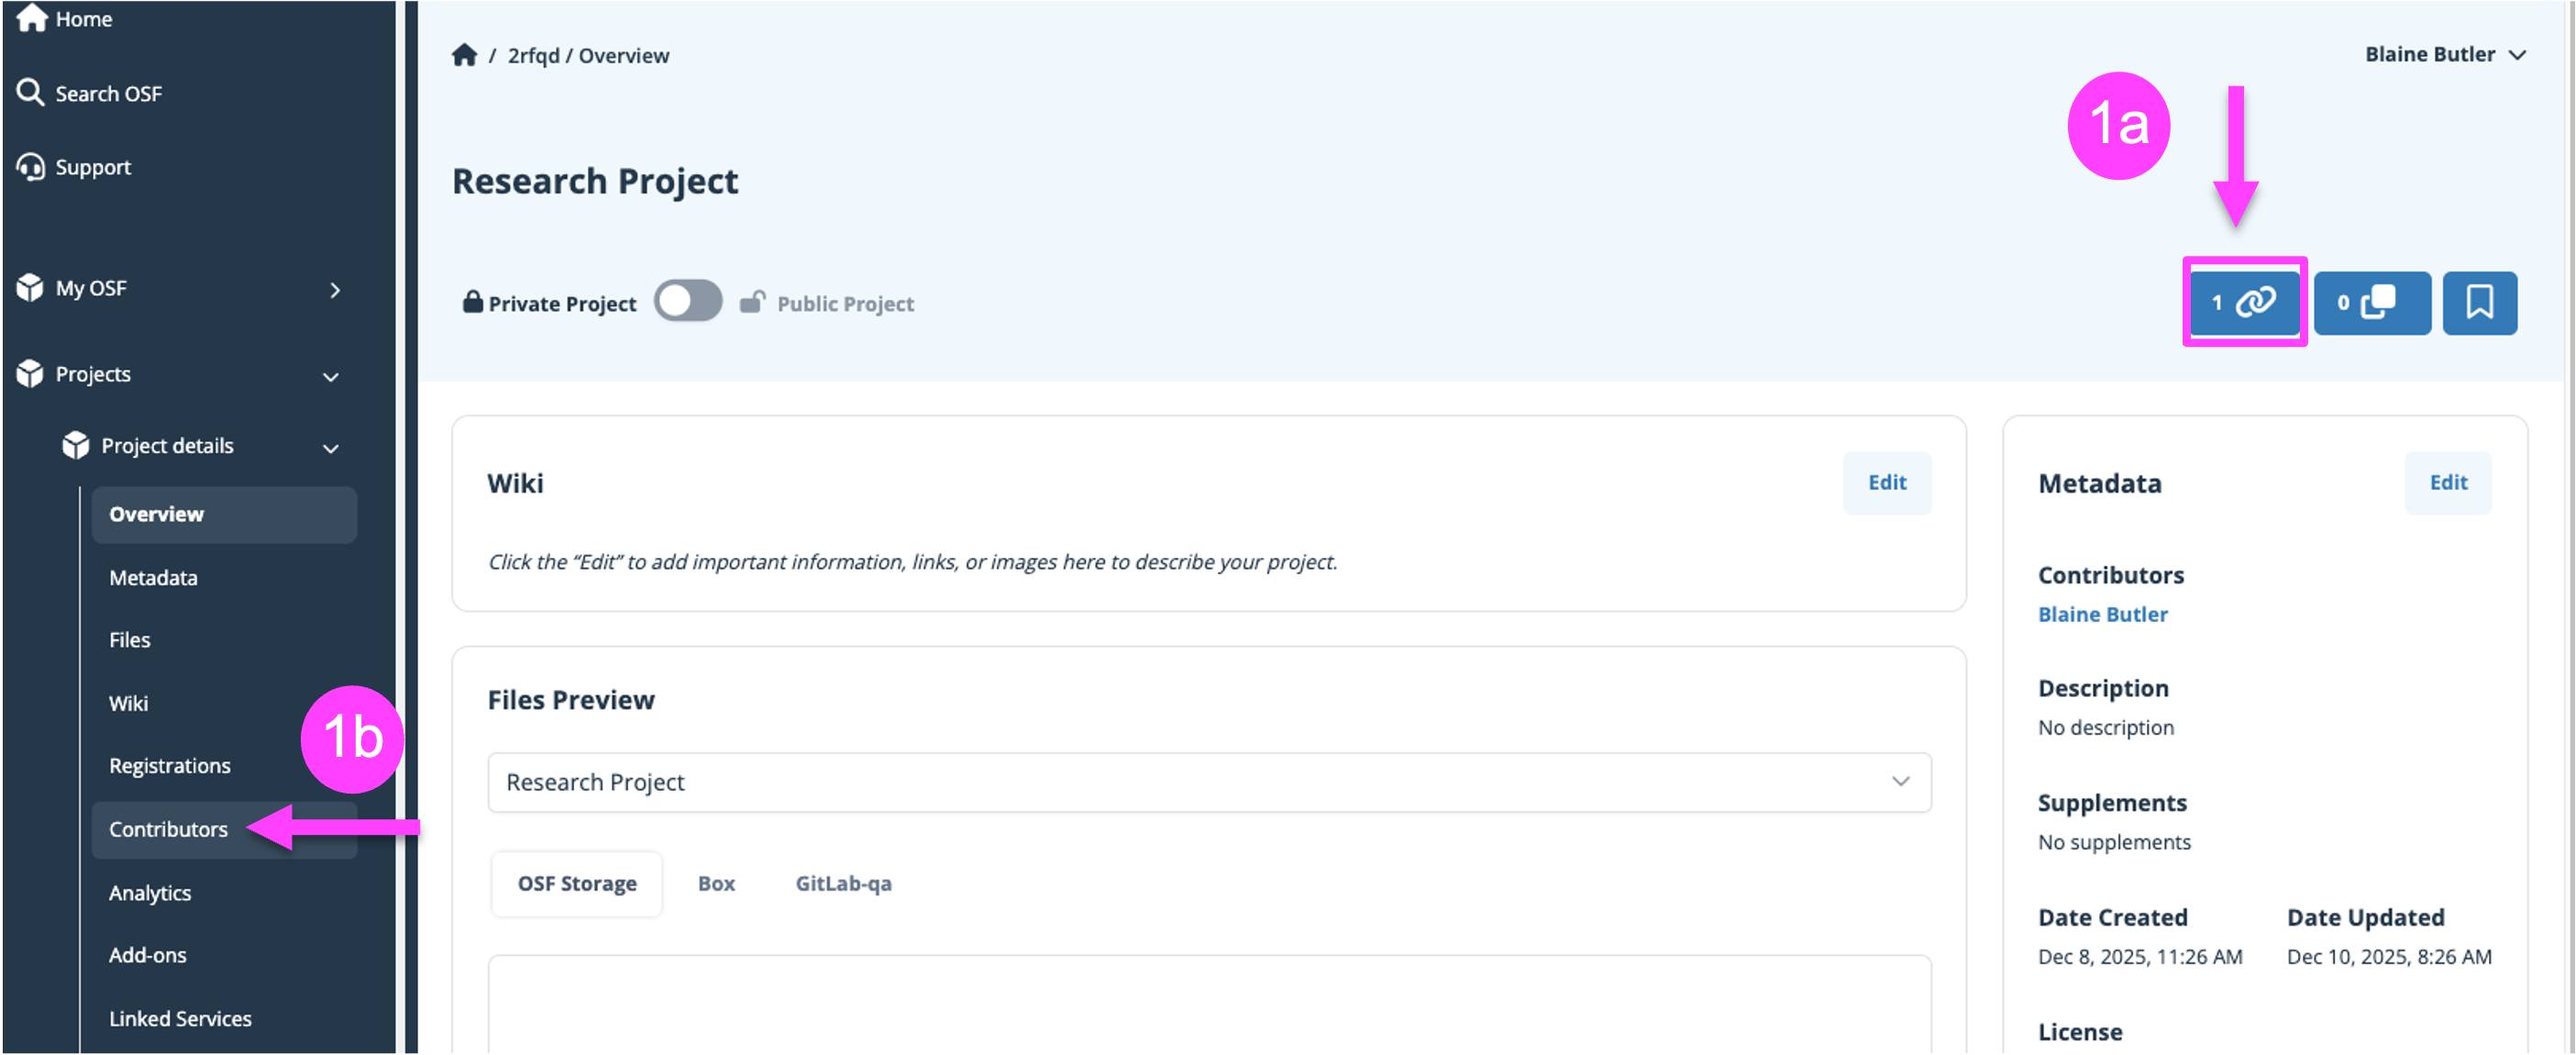
Open the project.
1a. Click the link icon in the upper-right corner
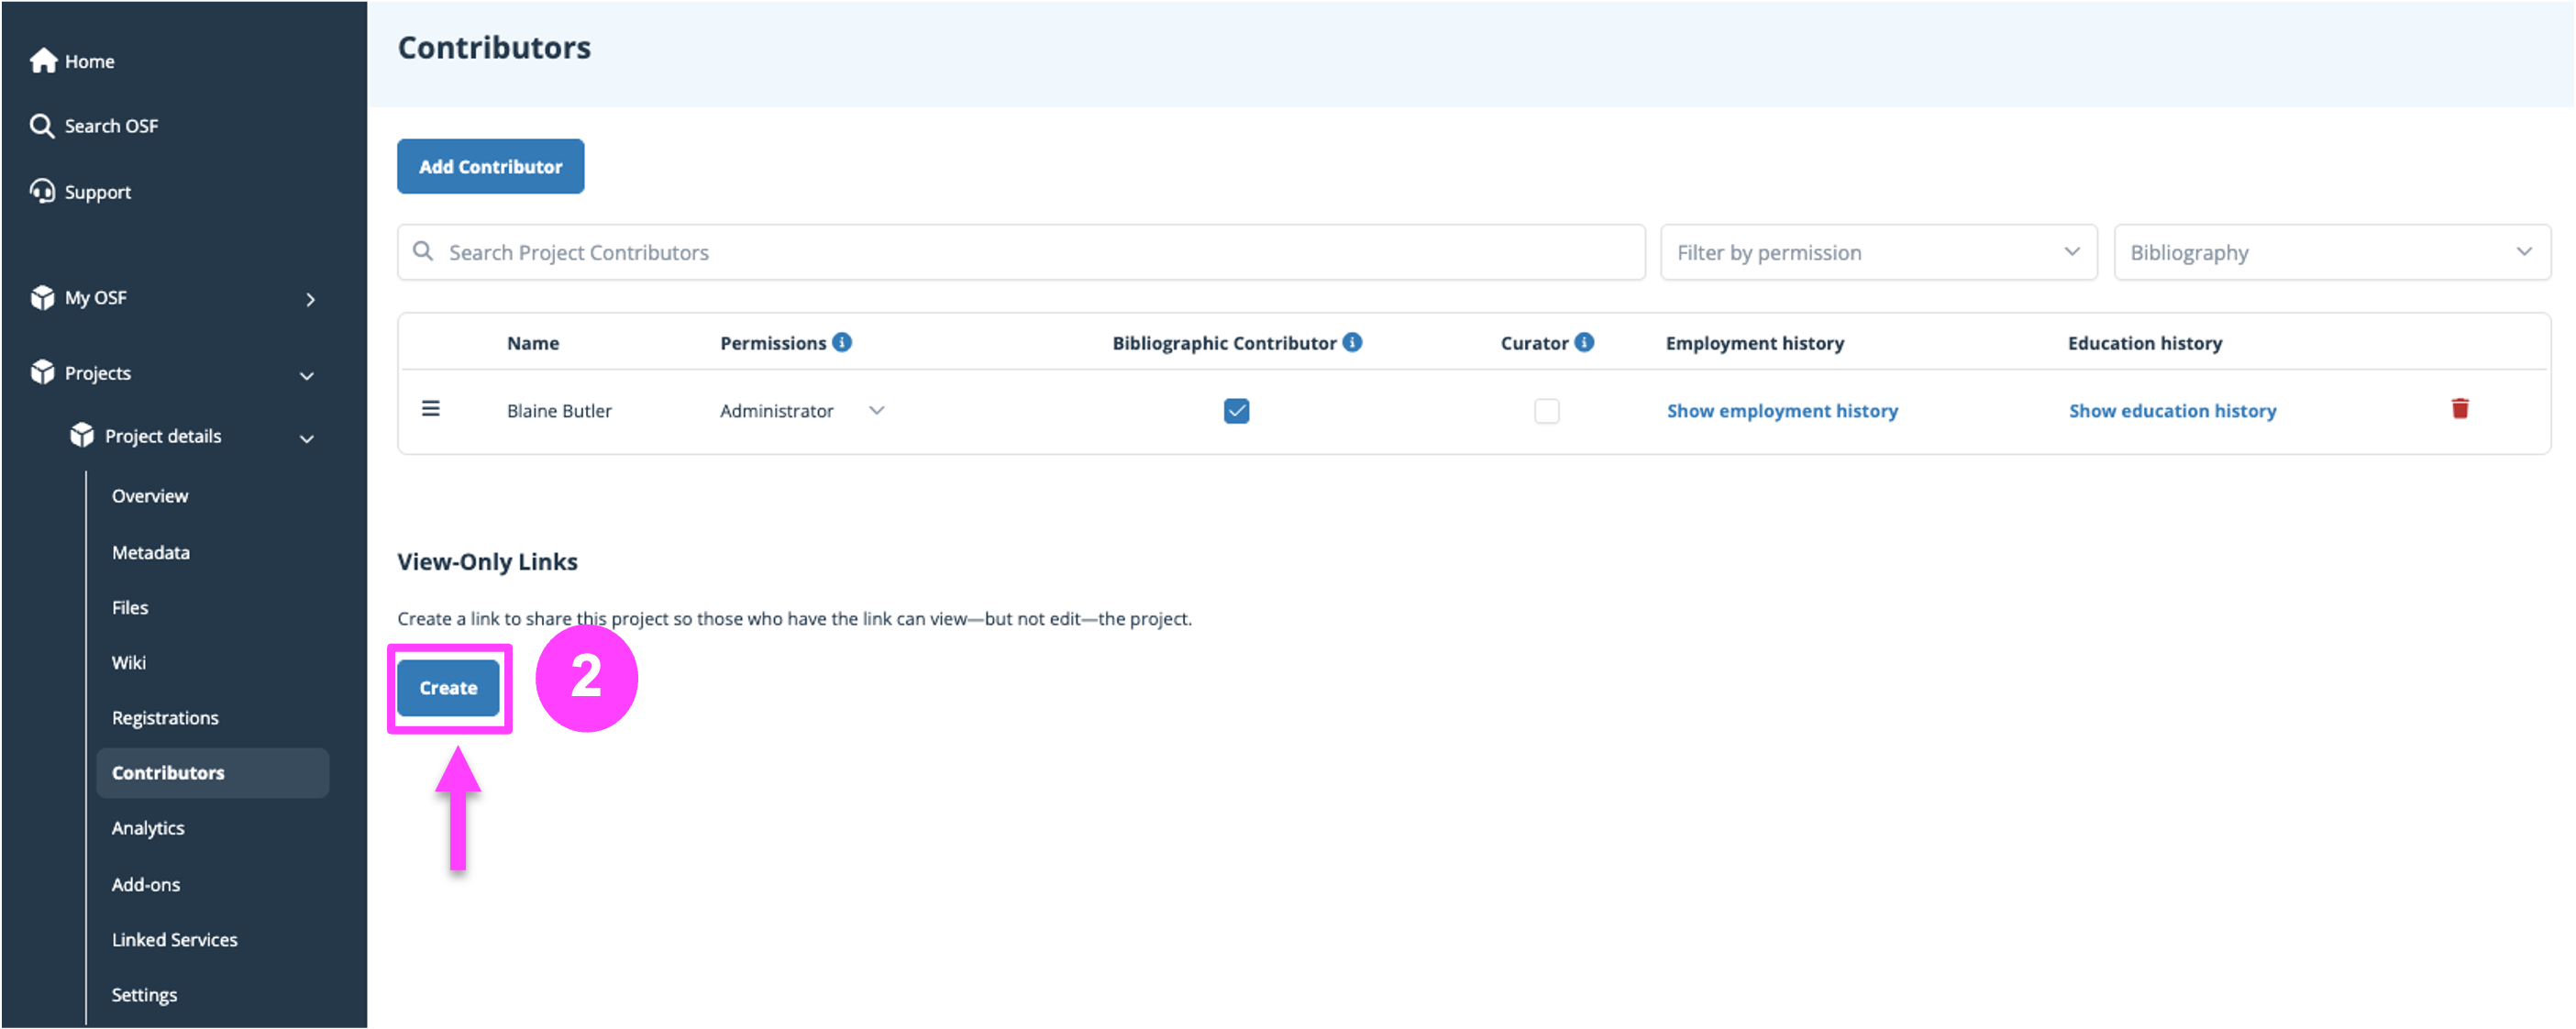
1b. Alternatively, navigate to Contributors and scroll down
- In the View-only links section, click Create.
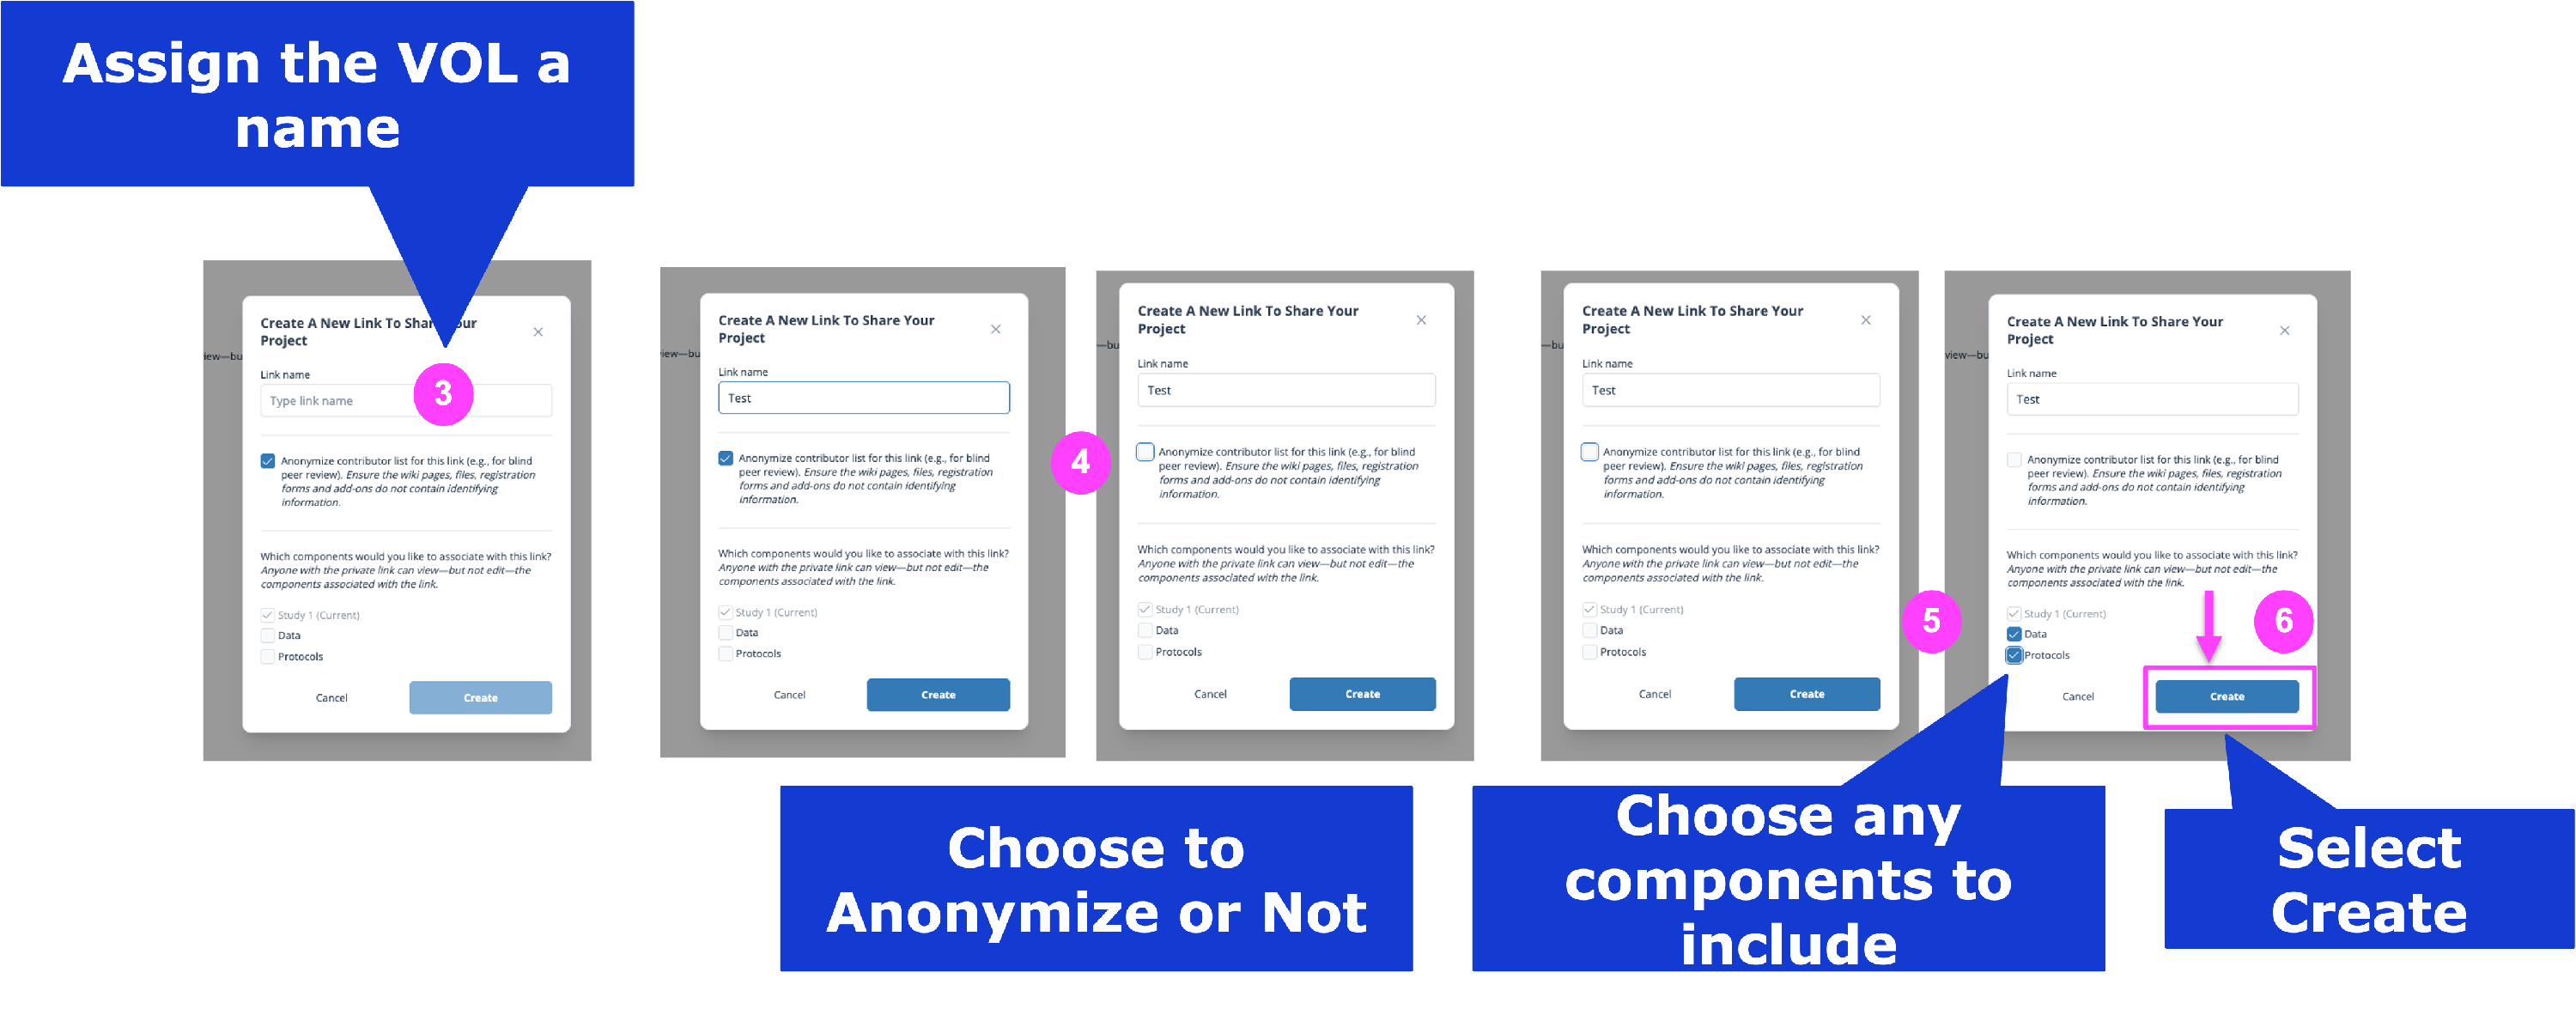
- Assign a Link Name
- Select Anonymize if you want to hide contributor names (useful for blind review)
- Select any components to include in the link.
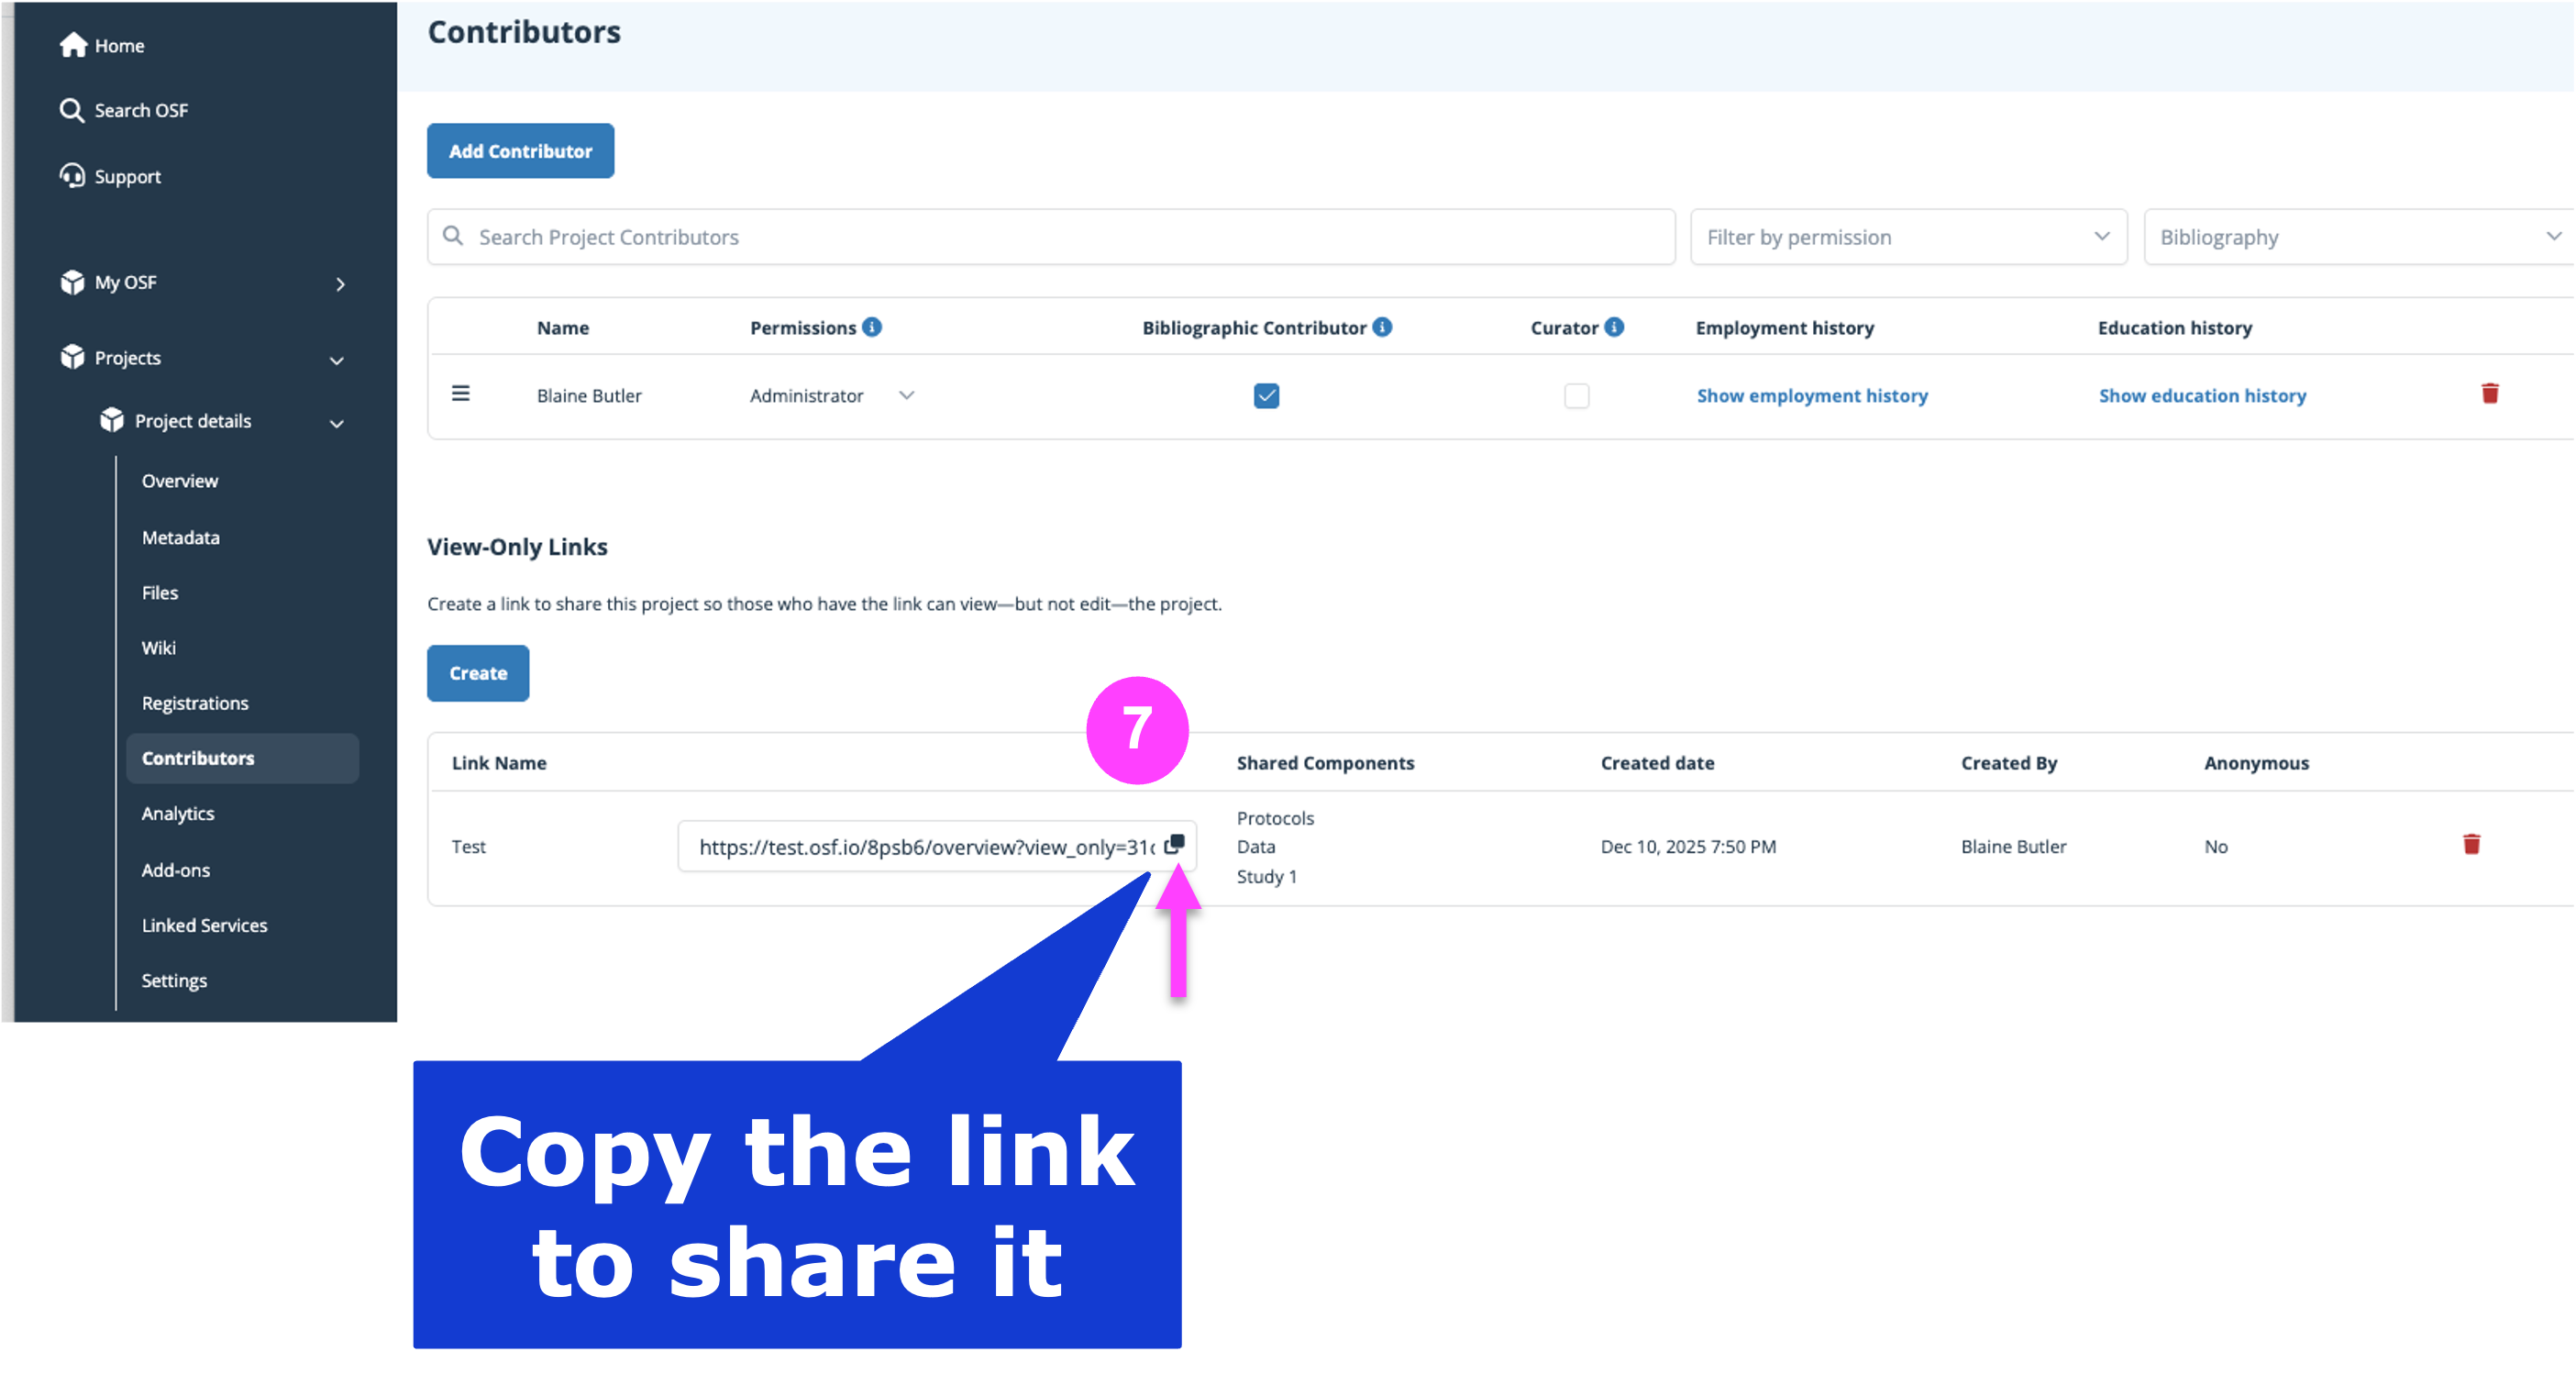
- Click Create—your link will appear in the list.
- Copy the link and share it as needed.
To Share the Link:
- Copy it using the copy icon next to the link and send it to viewers.
To Remove the Link:
- Click delete icon next to the link.
- Confirm deletion in the dialog box.
Notes:
- View-only links are read-only and immediate.
- They do not include registrations tied to the project.
Use Cases:
- Share drafts with reviewers without granting full contributor access.
- Distribute a blinded project for peer review.
License your project
Purpose: You can add a license to your project to allow others to copy, distribute, and make use of your data while allowing you to retain copyright. If you are not sure what license to apply to your work, see https://choosealicense.com for help.
How to:
- Open your project.
- Click to expand the Metadata section on the left hand navigation bar.
- Select the license you want to use.
- The license text will be displayed.
- For more detailed instructions see Editing Metadata (replace with your actual URL)
Generate Citations
Purpose: Make it easy for others to cite your work in academic publications.
How to:
- Open your project.
- Click to expand the Citation section on the project page.
- Copy the APA, MLA, or Chicago citation provided.
- To see more formats, type into the Get more citations box.
Share, Link, and Duplicate Projects
Purpose: Increase visibility through sharing and enable collaboration or reuse by others.
To Share a Public Project:
- Open the project.
- Click the branching Share icon on the top right.
- Choose a platform (email, X, LinkedIn, Facebook, etc)
- Edit and post using the pre-written prompt.
To Share a Public File:
- Go to Files on the project.
- Click the file name to open it.
- Click the branching Share icon.
- Choose to share via email, X, or Facebook.
To Duplicate a Project: This will create an completely separate project with either the same structure (structure only) or structure and files (with files).
- Open the project
- Click the Duplicate icon on the top right.
- Select “Duplicate project (structure only)” or “Duplicate project (with files)”
- Confirm by clicking Create.
- You will receive an email with a link to the duplicated version.
- Adjust privacy or rename the duplicate if desired.
To Link a Project or Registration: This will link another public project or registration directly to your project.
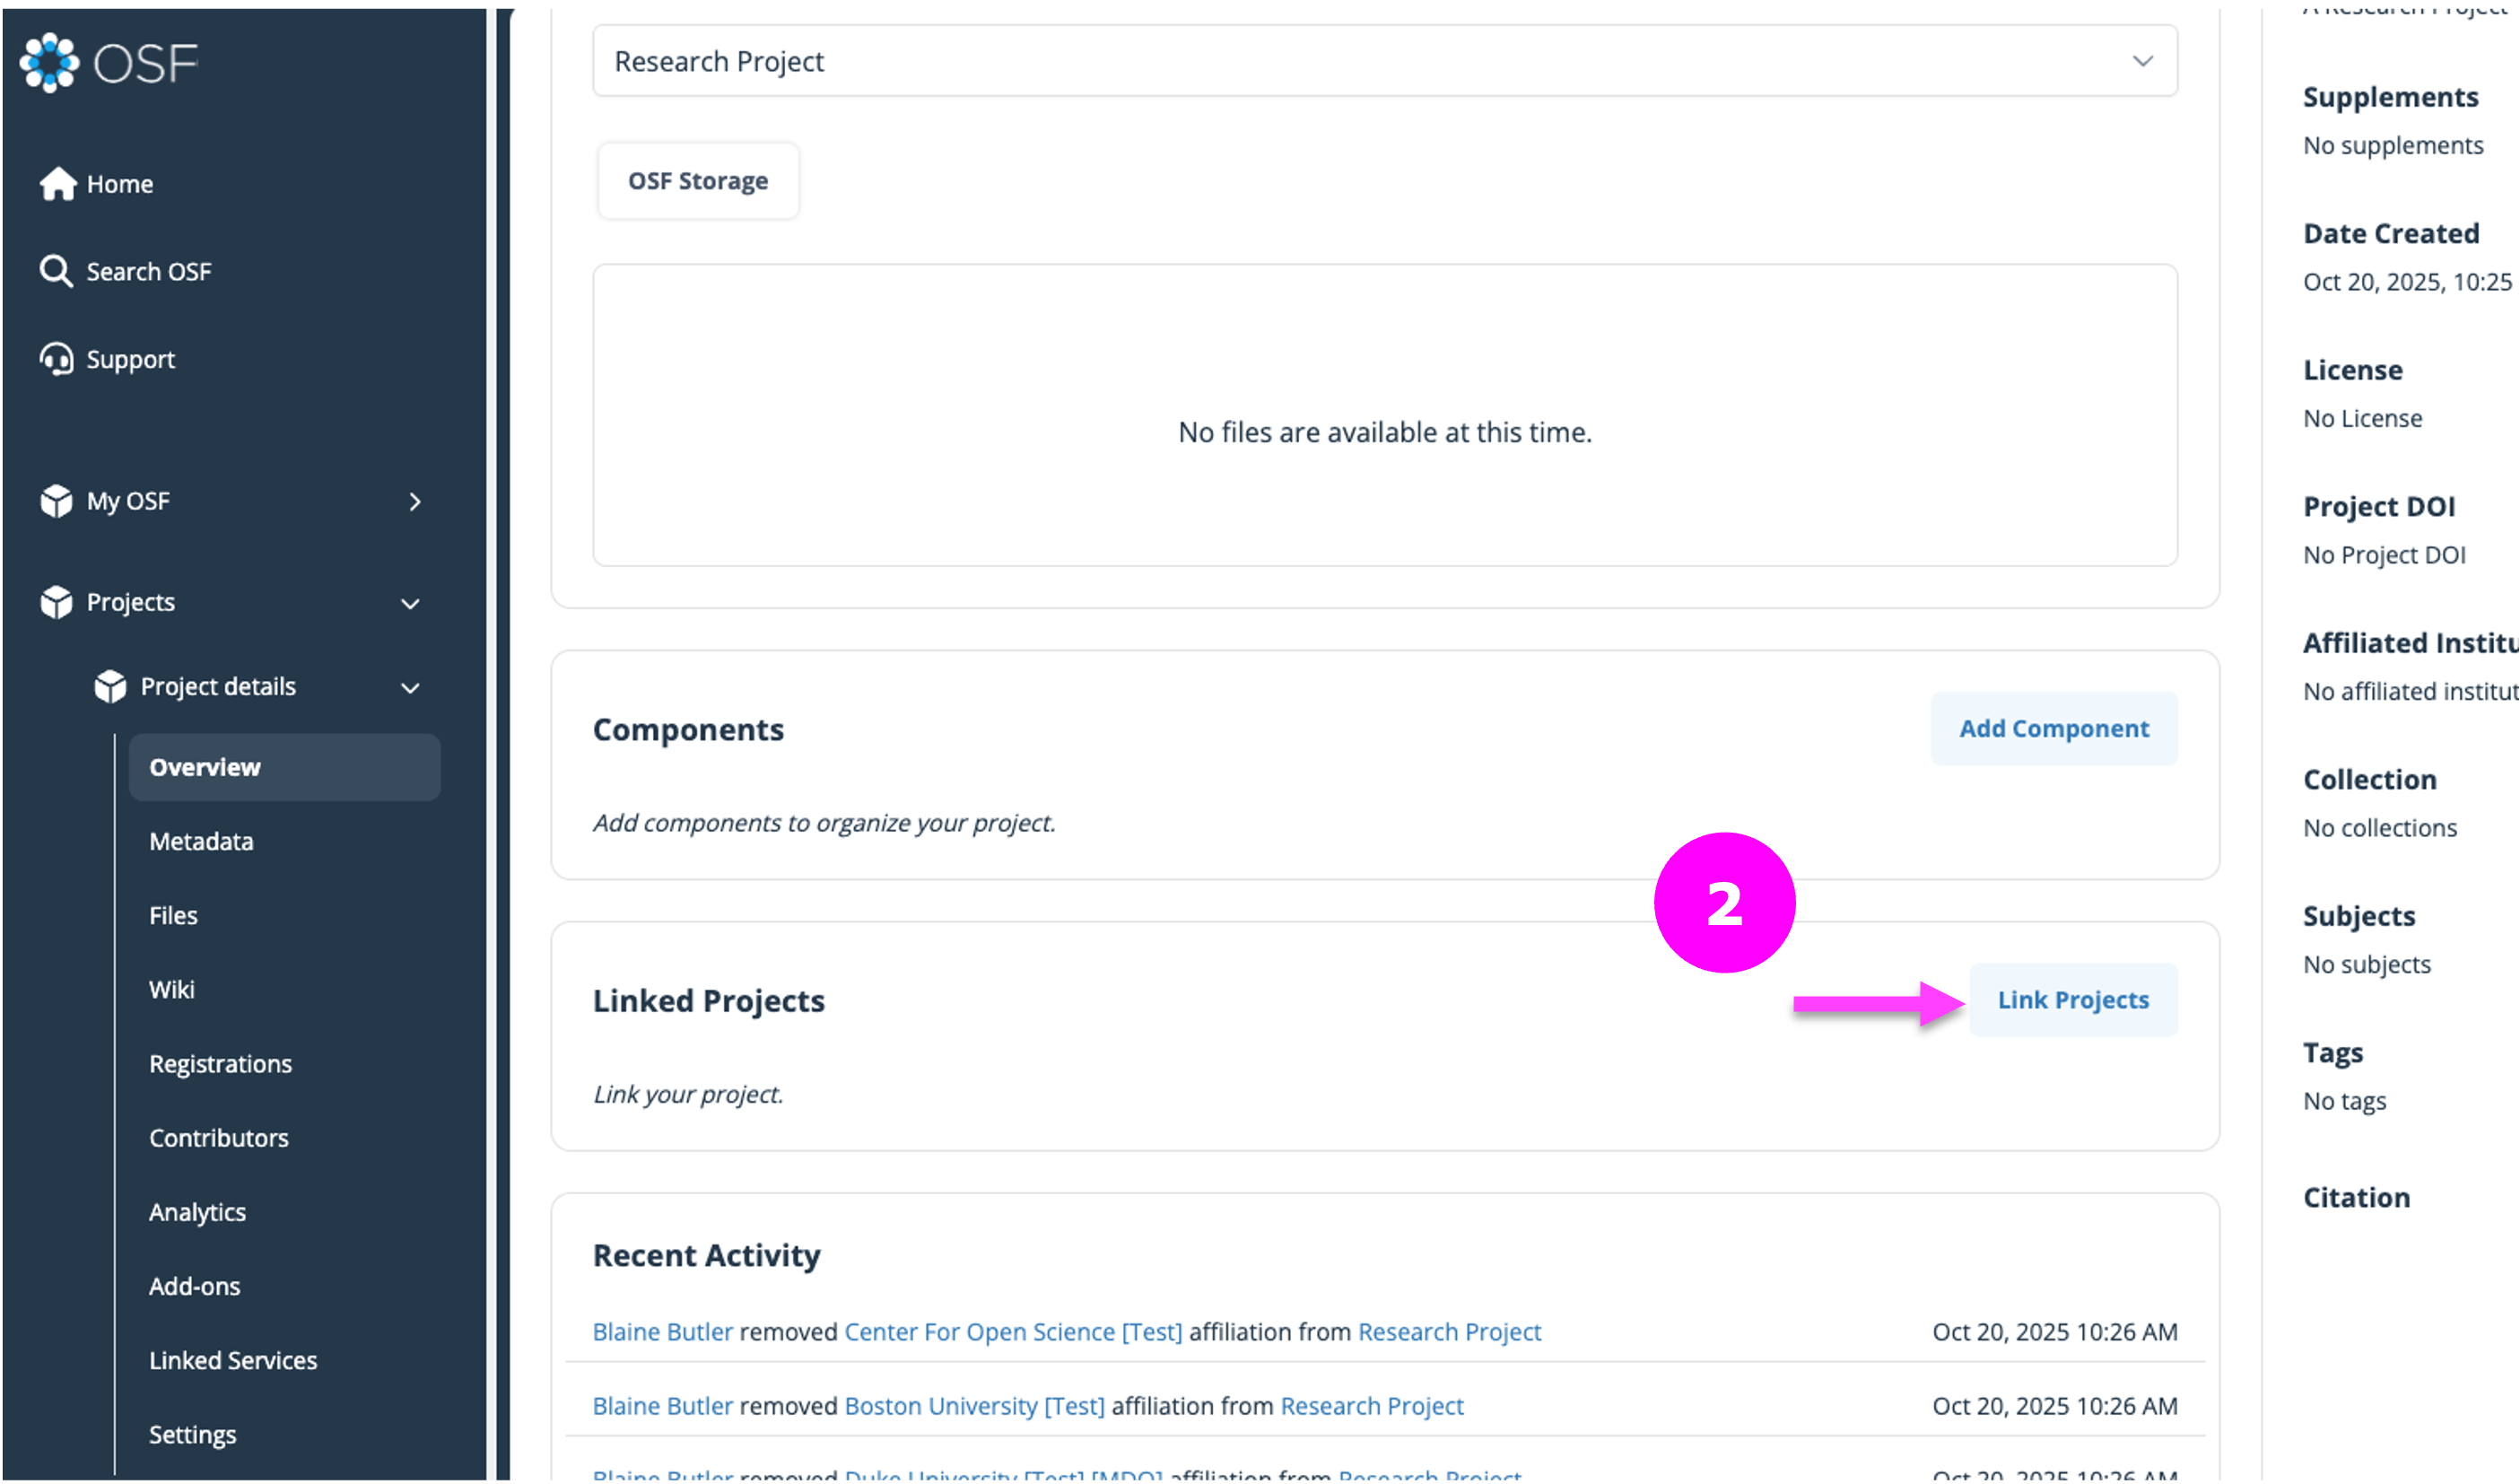
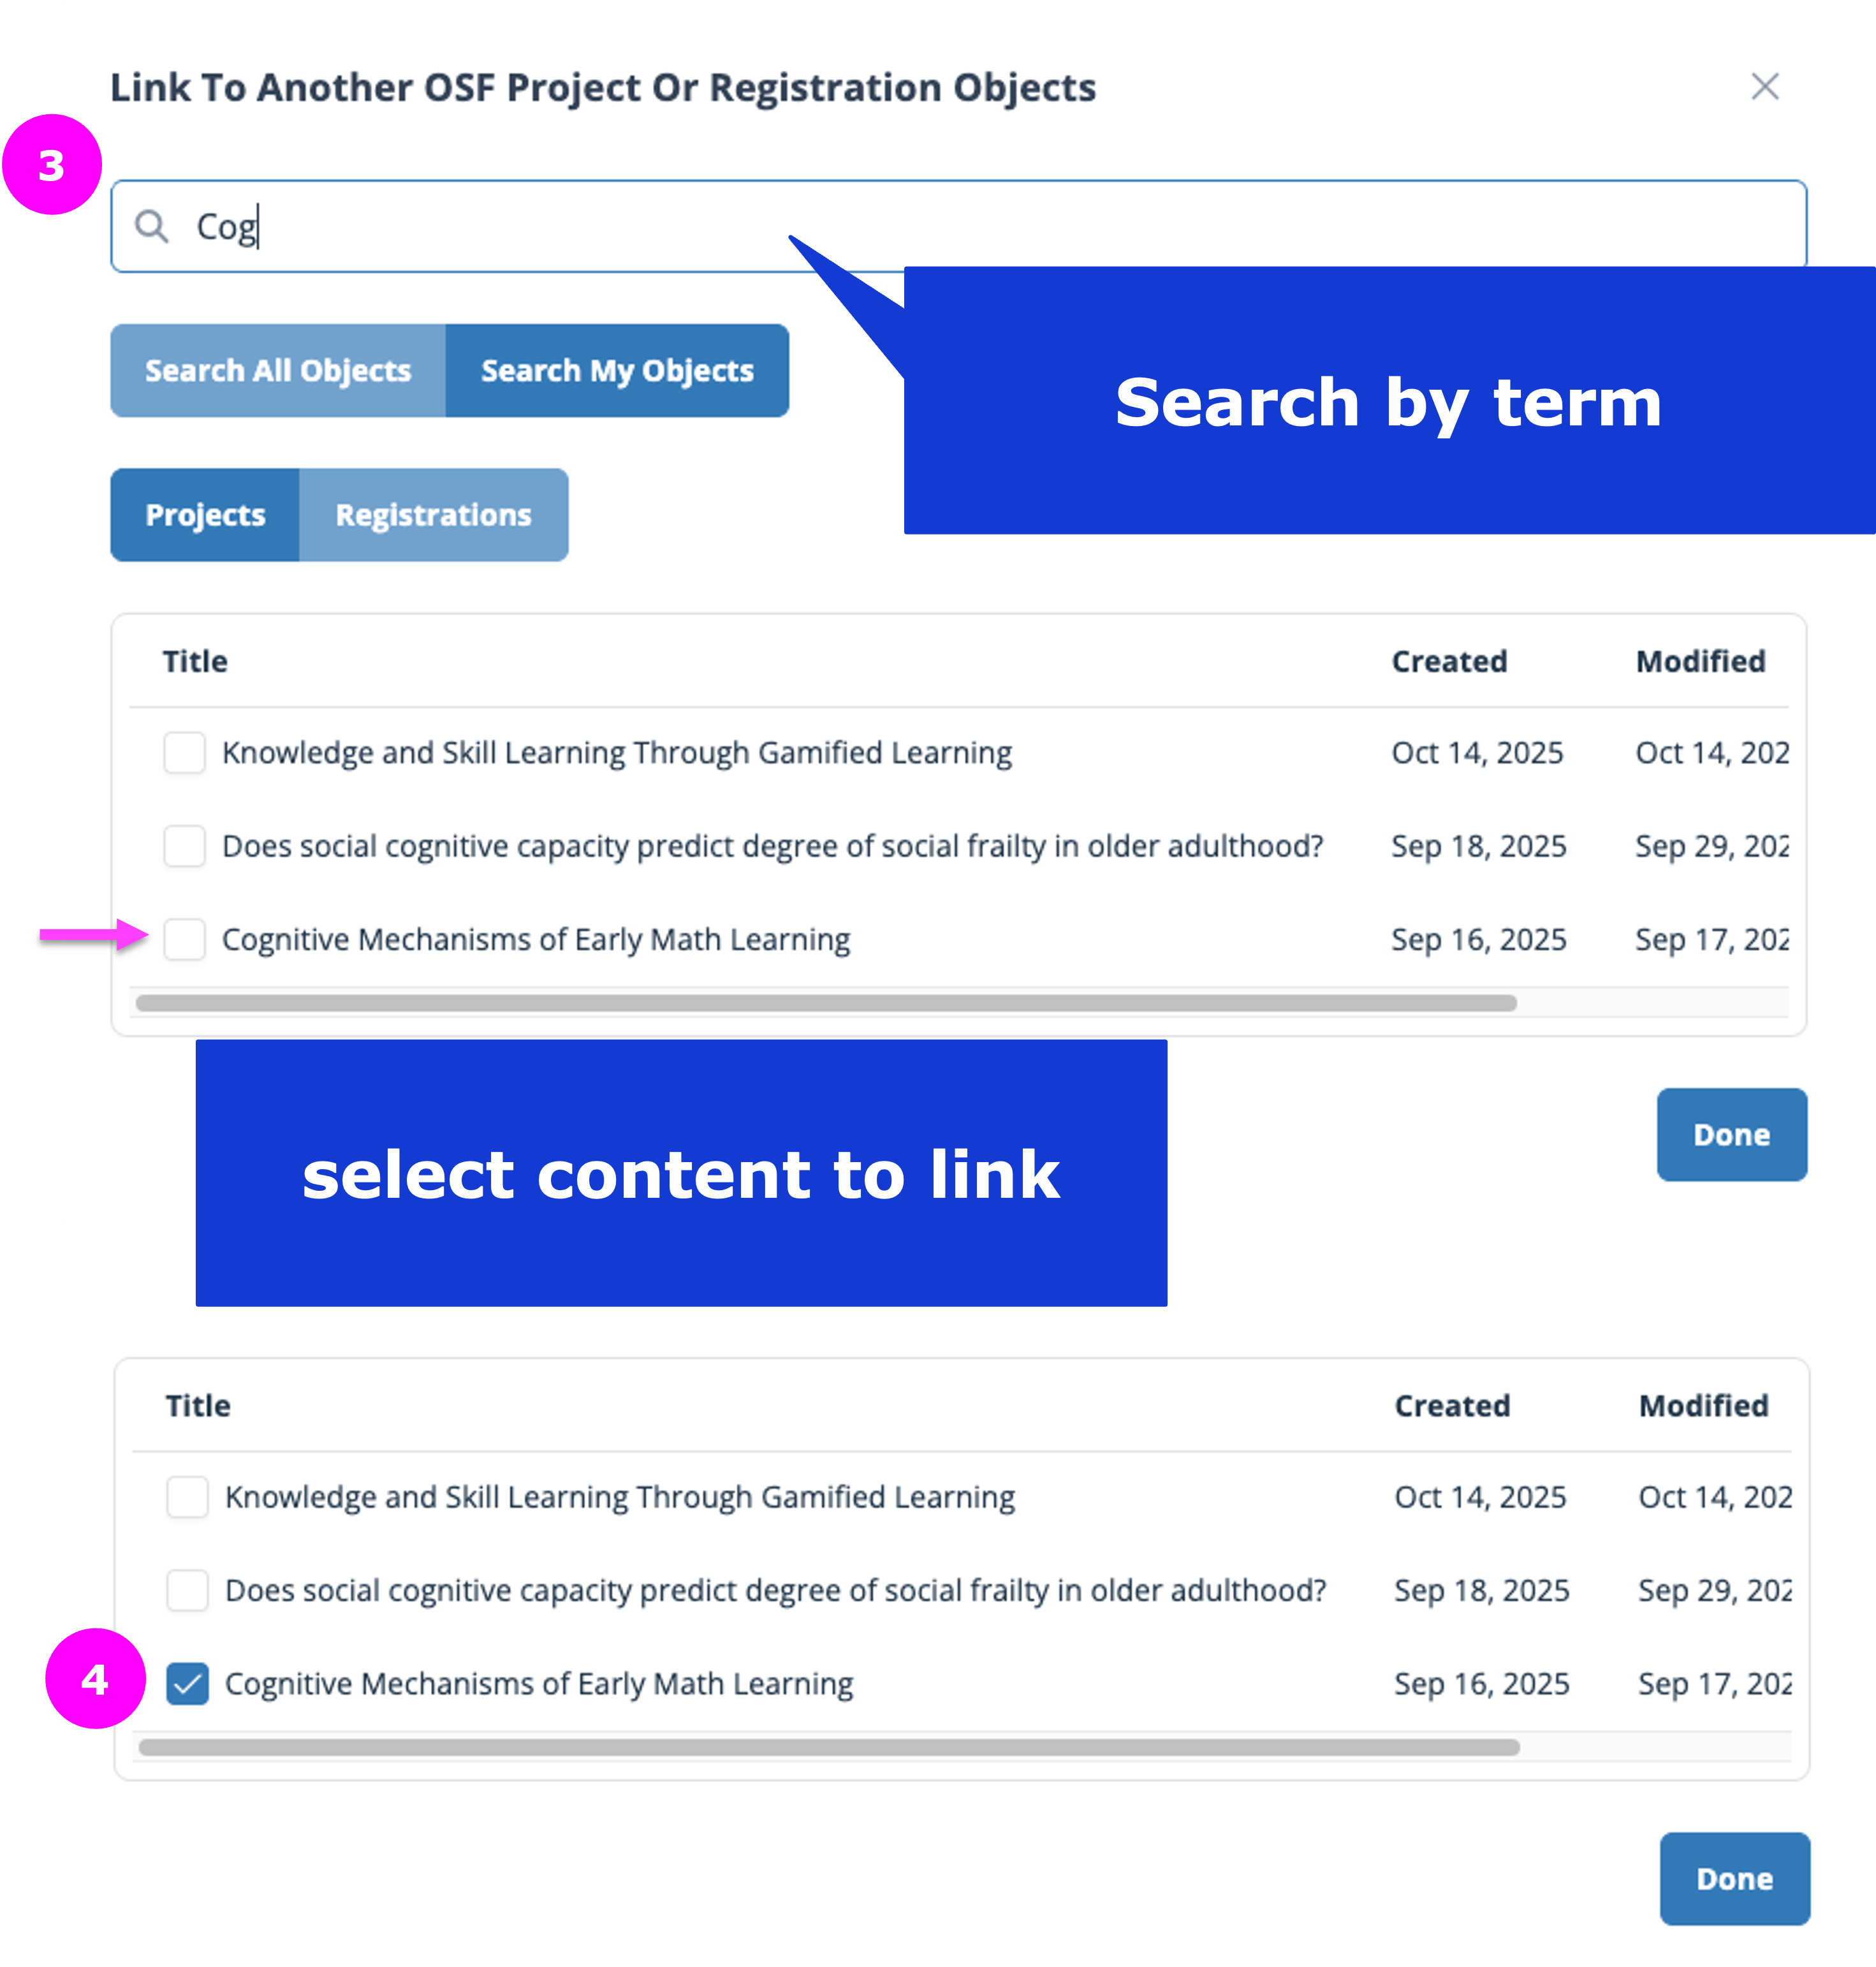
- Open the project
- Click the Link Projects button on the right.
- Search for the project or registration you want to link
- Select the correct project or registration
- Project or registration will now display in the Linked Projects section.
To Remove a linked Project or Registration: This will link another public project or registration directly to your project.
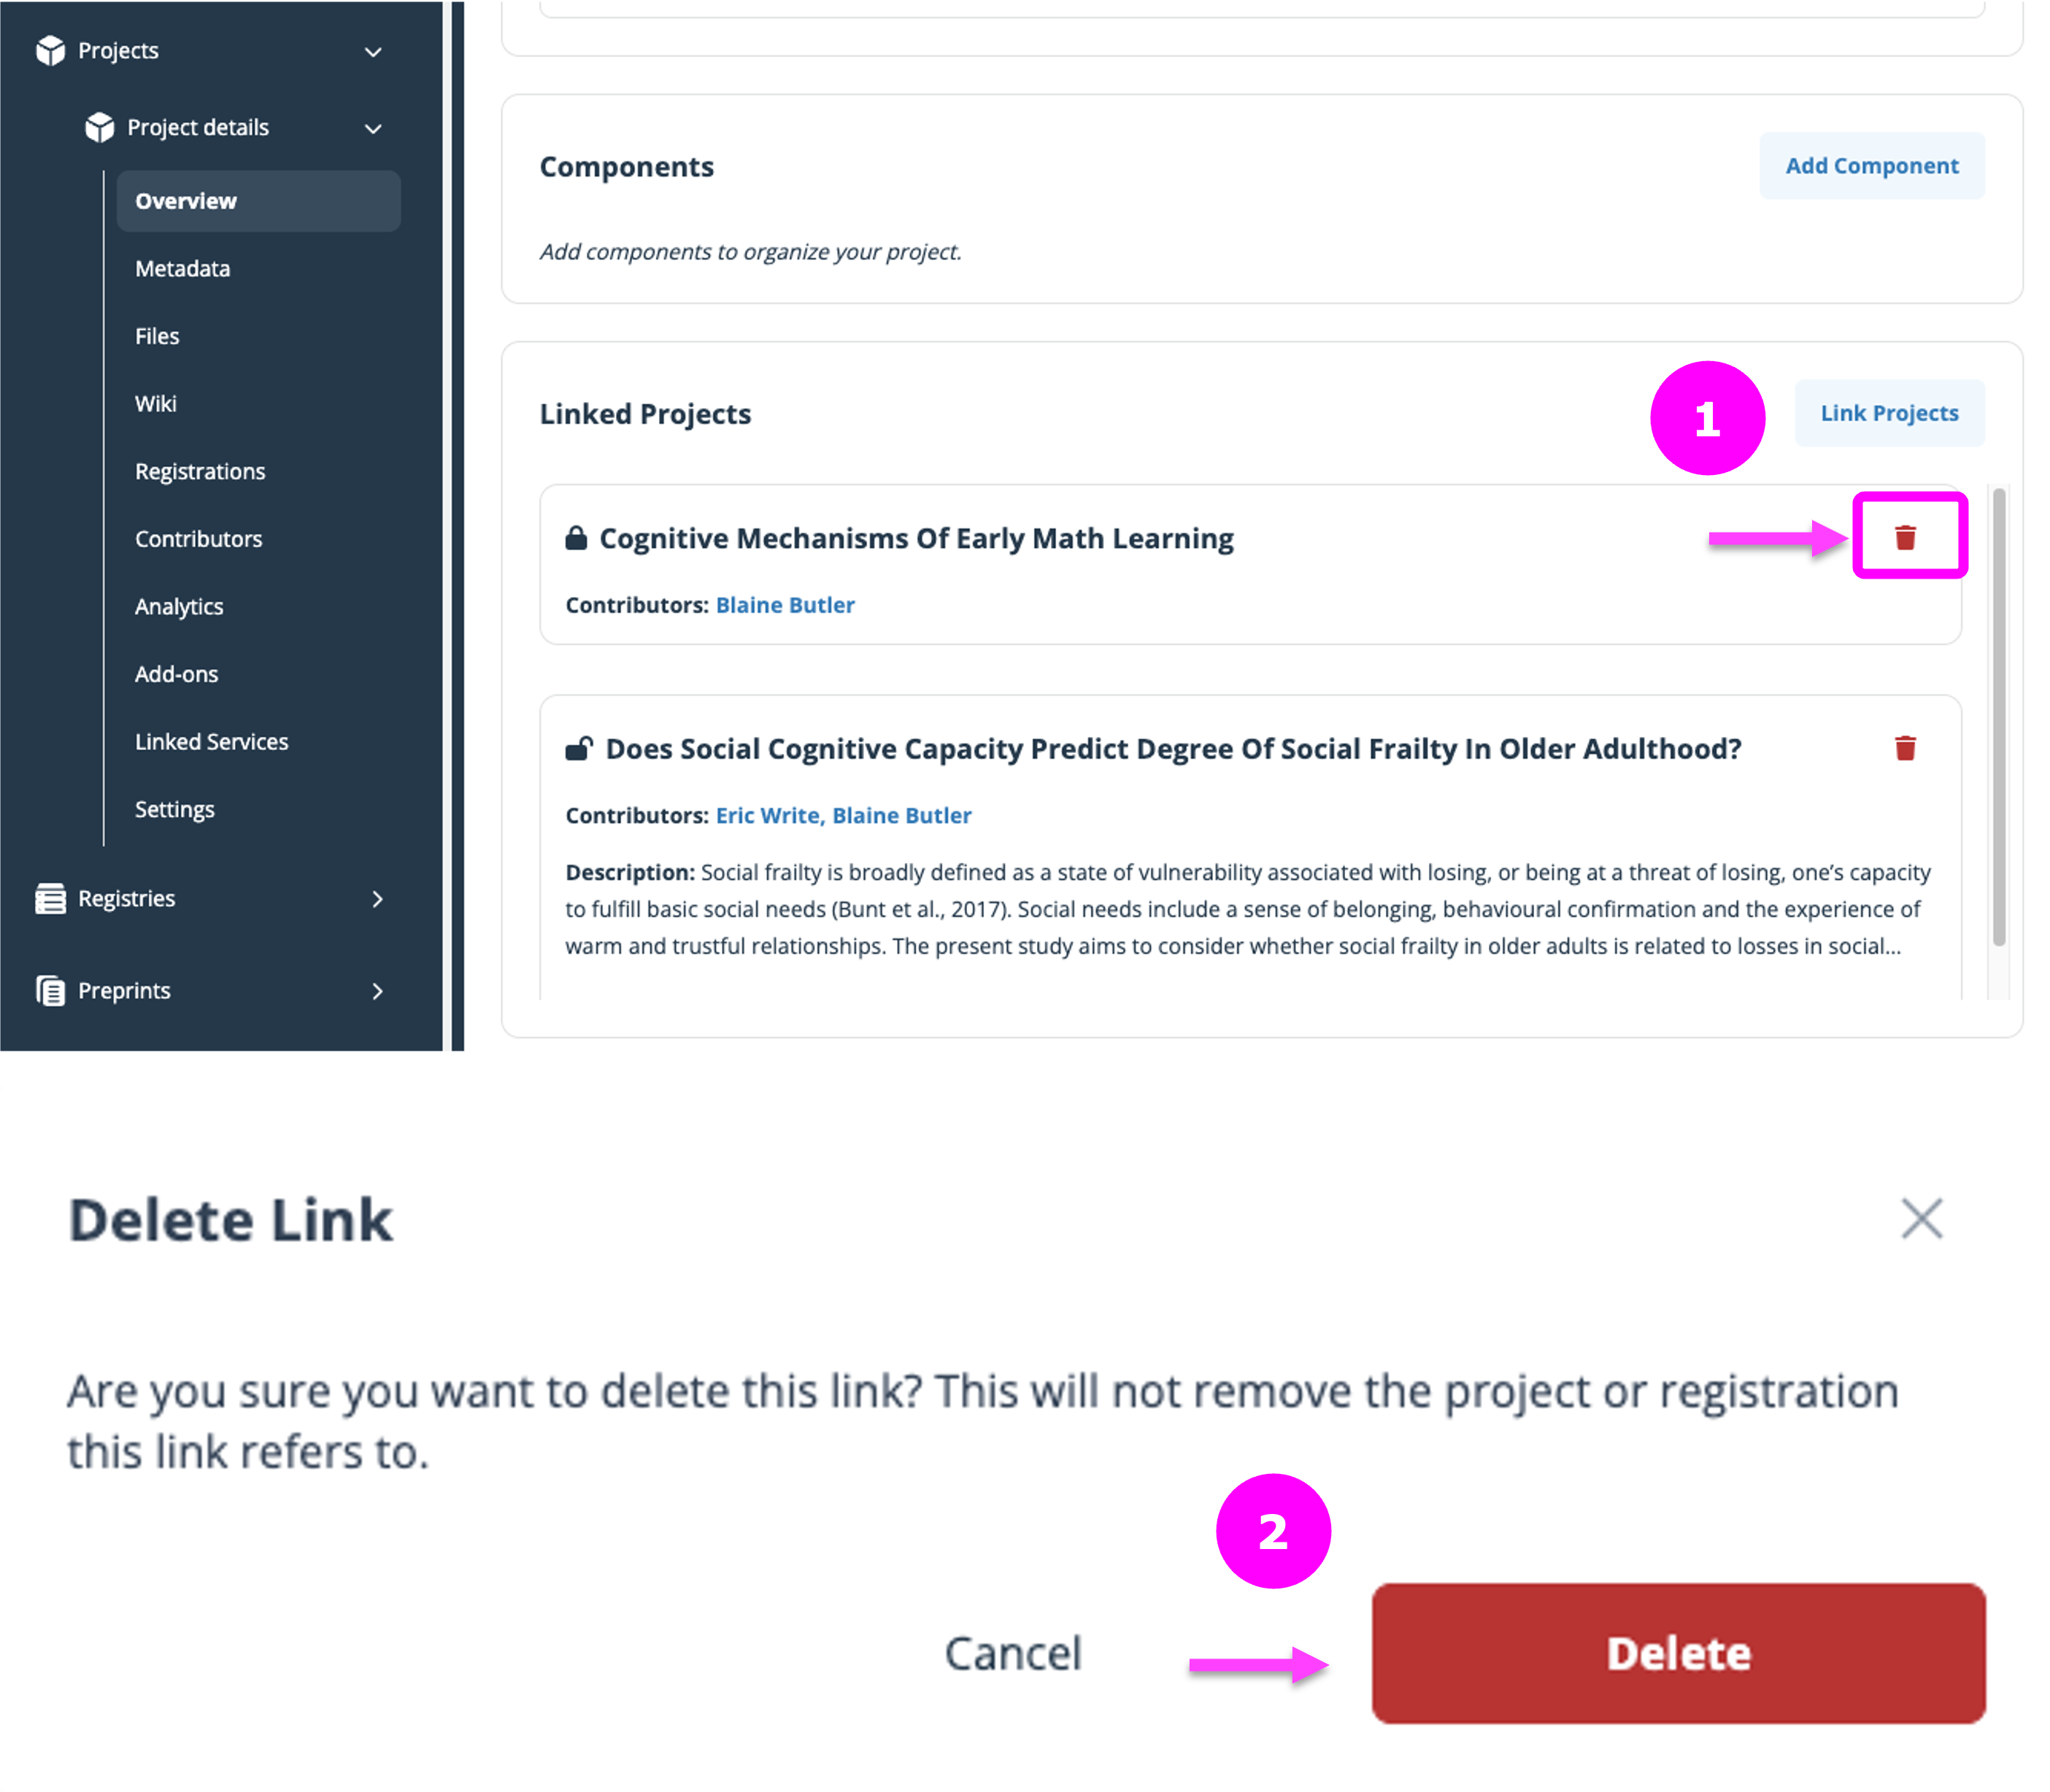
- Select the RED trashcan icon.
- Then confirm Delete.
Control Project Privacy
Steps to Change Privacy:
- Open your project.
- Find the Make Public/Private toggle at the top of the Overview
- Click to toggle visibility.
- If making public, review the prompt, select components to also make public, and confirm.
- If making private, choose which components to also privatize and confirm.
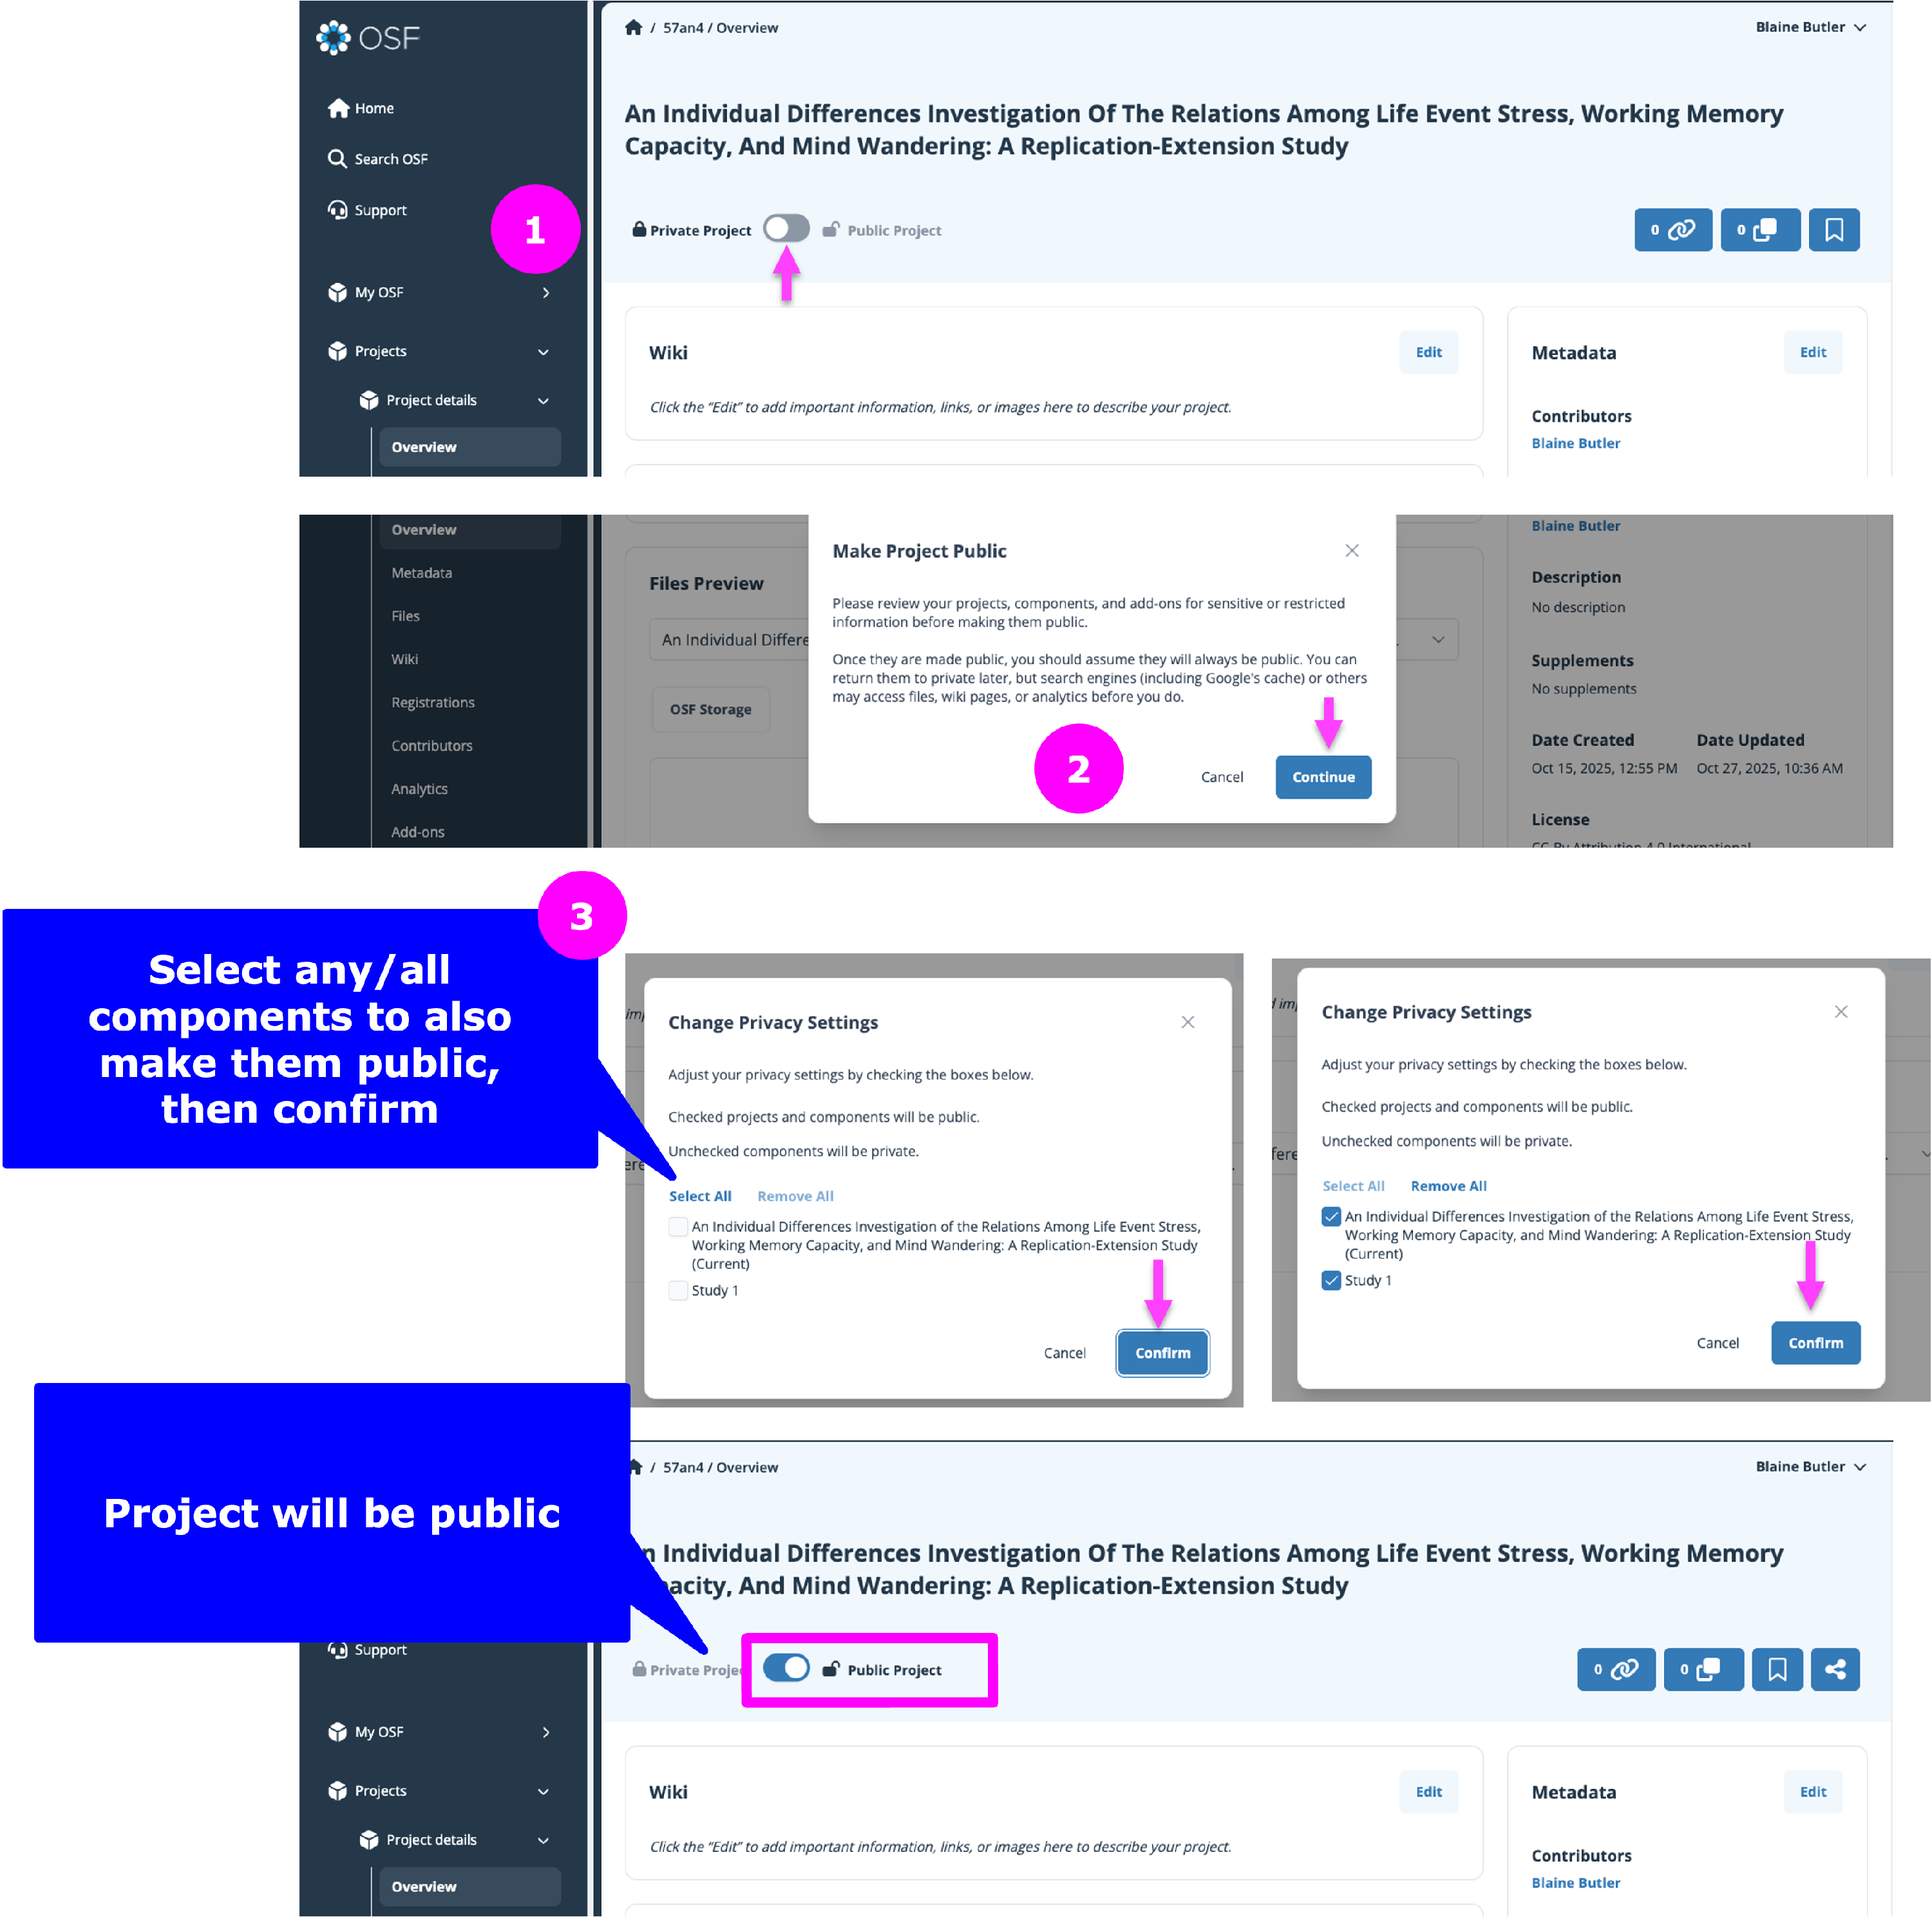
Use Cases:
- Keep sensitive drafts private.
- Release final datasets or manuscripts publicly.
Create a DOI
Purpose: Generate a persistent digital identifier to cite your public project in journals and repositories.
How to:
- Open the project or component.
- Make sure it is public.
- Open your project page.
- Go to Metadata on the left navigation menu
- Click “Edit” next to DOI.
- Click “Create” when prompted in the dialog box
- The DOI will now appear in the metadata section of your project.

Add a Project to a Collection
Purpose: Submit your project to a curated group of related research for greater visibility. Collections Help Guide.
How to:
- Go to the collection’s URL (e.g., https://osf.io/collections/<name of collection>).
- Click Add to Collection in the navigation bar.
- Choose your project from the dropdown.
- Add required project metadata (description, license, tags).
- Confirm contributor list and permissions.
- Provide any collection-specific metadata (e.g., volume/issue).
- Click Add to Collection.
Note: Submitting to a collection will make your project public.
Advanced Uses of OSF Projects
The Open Science Framework (OSF) allows researchers to manage complex workflows, organize content across multiple tools, and streamline collaboration. This guide will walk you through advanced strategies including using components, storage and citation add-ons, automation, and custom integrations to maximize your research impact.
Use Components for Complex Project Structures
Components are sub-projects within your main OSF project and are perfect for breaking down large or multifaceted research efforts. Each component can have its own files, collaborators, permissions, wikis, and even child components.
Best Practices for Using Components:
-
Segment by Research Phase or Material Type
Create components like “Literature Review,” “Data Collection,” or “Analysis” to group relevant files and collaborators.
-
Assign Specific Collaborators
Grant access at the component level to tailor contributor permissions and maintain privacy where needed.
-
Organize Pilot Studies or Sub-Analyses
Use components to keep methodologies and outputs clearly separated and documented.
-
Use Wikis for Process Documentation
Each component has a wiki—use it to track decisions, protocols, and changes over time.
-
Customize Access Settings
Components can be public or private independently of the main project. This is useful for data sensitivity or phased sharing.
-
Create Nested Components
For large projects, you can add components within components to mirror detailed research structures.
Leveraging components improves transparency, collaboration, and findability—especially when combined with persistent identifiers.
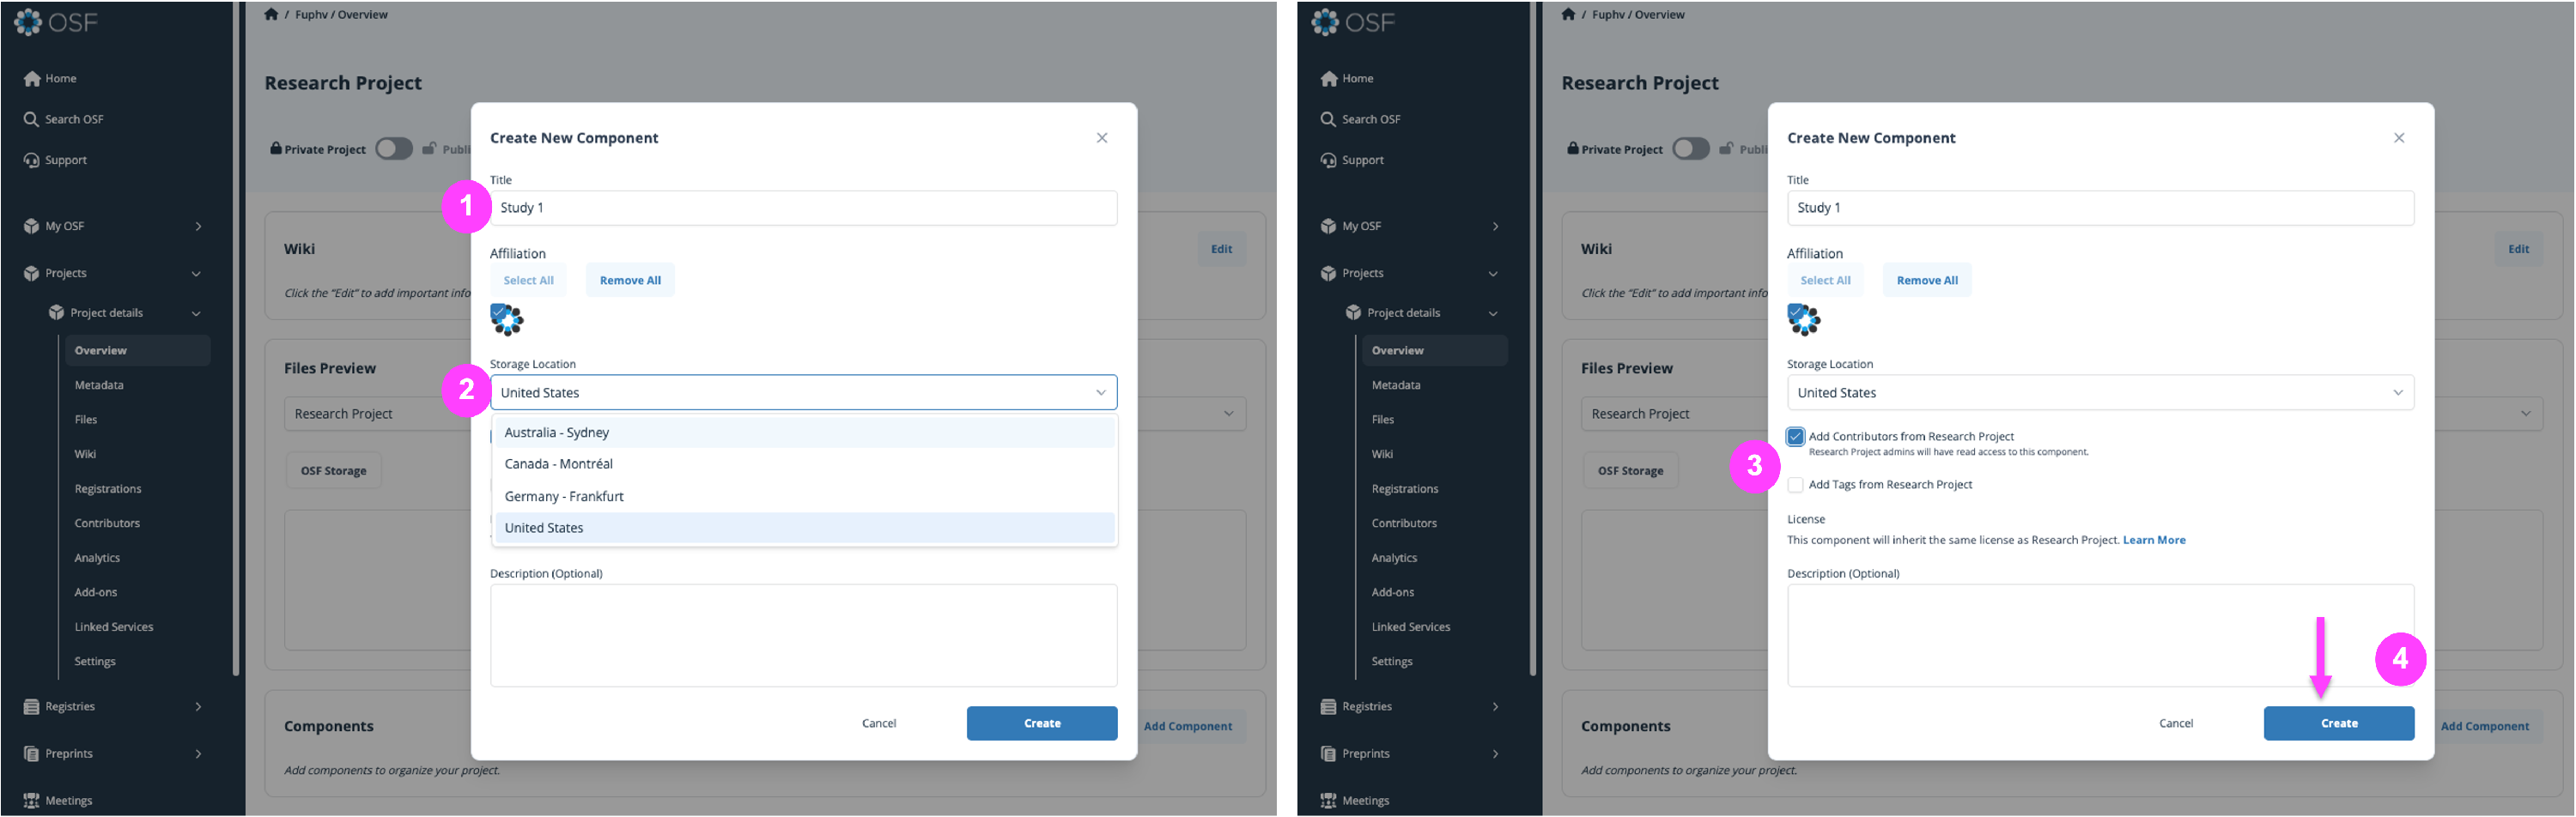
Create a Component
On the project overview page select "Add Component"
- Then enter the Component Title
- Followed by selecting the Storage Location
- Then you can choose to automatically add contributors from the parent project or not, and Tags from the parent project.
- Then select Create.
Integrate with Storage Add-ons or External Systems
OSF add-ons let you connect external tools—such as cloud storage and citation managers—to your OSF project. This creates a unified workspace for your research process and outputs.
Supported Add-On Categories:
Storage Add-Ons
Allow you to sync folders/files from external cloud platforms:
- Box
- Dropbox
- Google Drive
- OneDrive
- GitHub / GitLab
- Figshare
- Dataverse
- Bitbucket
- OwnCloud
Citation Add-Ons
Aggregate and organize references directly within your OSF project:
- Mendeley
- Zotero
Once connected, storage folders and citation libraries appear directly within your project file tree for easy access.
Connect Citation Add-Ons: Citation Add-ons Help Guide
Connect Storage Add-Ons: Storage Add-ons Help Guide
Special thanks to The University of Manchester for supporting the improvement of our Amazon S3 add-on functionality!
Automate Project Setup Integrations
To simplify and standardize research workflows, OSF supports creating new projects from templates and building automated integrations via its open API. For templates see section on creating a project from a template for more information on the API see
FAQs
What is the distinction between the different category options on projects?
Categories on OSF projects are a way to organize projects and nested components (subprojects). Each category can represent the organization of the components. An example is how to organize a research group using OSF projects.
I have mistakenly changed my permission level from administrator of a project to read+write. How can I change it back to administrator?
Only an administrator can change a contributor's permission level to an administrator. Contact your fellow administrator on the project to change your permissions using this help guide: Edit Contributor Permissions.
Does my project have an ID number? What is a DOI?
Public projects on the OSF can be assigned a DOI which is often considered to be an “ID number”. A Digital Object Identifier (DOI) is a unique identifier that is persistent and maintained. This prevents broken links and preserves the accessibility of data stored on an OSF project. To create a DOI for an OSF Project or component, please see this help guide: Create DOIs. DOIs are minted for preprints and registrations automatically when they are made public.
I have a project on OSF but searching the associated DOI on google doesn't bring up the page in results. Is the DOI active?
OSF Projects are not necessarily indexed on Google. We cannot control what Google decides to index and does not. They are minted by Datacite and can be found on DOI.org.
What are the storage limits for projects and components?
Public OSF projects are given a 50 GB storage space, Private OSF projects are given 5 GB storage limits.
What is the difference between a component and a folder?
A folder can be used to organize files within a project or component - just like a folder on your own computer groups files together. A component is like a sub-project to help you organize different parts of your research. Components have their own privacy and sharing settings as well as their own metadata and unique, persistent identifiers for citation, and their own wiki and add-ons. You can also register a component on its own, without registering the parent project. (Learn more).
How can I license my data/code/etc.?
To apply a license to your OSF project, visit the project's "Overview" page and select one from the "License picker" in the top left of the page below the project's description. You can select from a variety of commonly used licenses or upload your own. (Learn more).
How do I delete a project or component?
Only an administrator can delete a project or component. To delete a project or component, navigate to the project or component and click on Settings in the gray navigation bar. There you will see a red Delete button. If the project or component has nested components, you must delete the nested components before you can delete the parent project or component. (Learn more).
What's a globally unique identifier (GUID)? What metadata is maintained about them?
A globally unique identifier, or GUID, is a unique string only assigned to one object on OSF. All files, projects, preprints, registrations, and users on OSF have a GUID. Privacy settings dictate who can see the metadata about files, projects, components, or registrations. If a file is deleted or withdrawn, the GUID will always resolve to a page that provides metadata about the removed file (file name, storage provider, if the deletion occurred on OSF or on an add-on service, name/GUID of user who deleted the file, and timestamp of file deletion). For deleted or withdrawn projects, components, registrations, and users a similar page will exist at that GUID noting that the content has been removed.
How do I rename a project?
You can rename a project by editing the title in the Metadata section.
I'm a contributor on a private project but can't seem to access it. What happened?
You may have been removed from the project by one of the administrators. You can get in touch with one of the administrators to ask if you were deleted and whether they can re-add you to the project.
I have a DOI for my OSF project. Can I host the material outside of OSF without losing the DOI?
Yes, send us an email with your DOI and the non-OSF location of your materials and we will update the URL associated with your DOI. Contact our support team using the support center beacon found on the bottom right side of any OSF support page:

I can't find my project when I search for it on OSF. What’s wrong?
The search function only returns public projects, so if you are searching for one of your own private projects, it will not be returned in the results. To search for your own projects, go to your dashboard (by choosing “OSF Home” from the navigation bar) and look through the list displayed there, or use the "My Projects" tab in the navigation bar. (Learn more).
Can I nest a subproject inside my existing projects?
It isn't possible to move projects to be nested below one another at this time. However, you can simulate this structure by adding links to the desired projects from the main project, and the links will appear on the project page under "Components" — see our section on how to link a project for step-by-step instructions.
Why is my location (country) an option for Project storage?
You can set a global storage location for newly created projects. Different locations can be set on a per-project basis upon creation. You can also set a default global storage location in your user profile. Setting this is not retroactive: All existing projects will continue to be stored in the United States. As of now, the storage locations available are
- United States
- Canada - Montréal
- Germany - Frankfurt
- Australia - Sydney
Files connected to third-party storage add-ons are not stored or backed up on OSF. Please refer to the provider's server locations for information on where this content is stored
What are components?
A component is like a sub-project to help you organize different parts of your research. Components have their own privacy and sharing settings as well as their own unique, persistent identifiers for citation, and their own wiki and add-ons. You can also register a component on its own, without registering the parent project.
This Article Is Licensed Under CCO For Maximum Reuse.